| Previous | 5 Server configuration and management | Next |
|---|
5.15 Data collection time stats
The page shows which equipments took the most time to collect data from in the selected timespan. Initially it has a table with the different machines on which PVSR collector modules are configured. For each entry it also shows the configured collector modules with their statuses (Running, Down, Unknown) or as “Not supported” which means that the collector module does not provide data collection time stats. A machine can only be selected if it has at least one collector with the status Running.
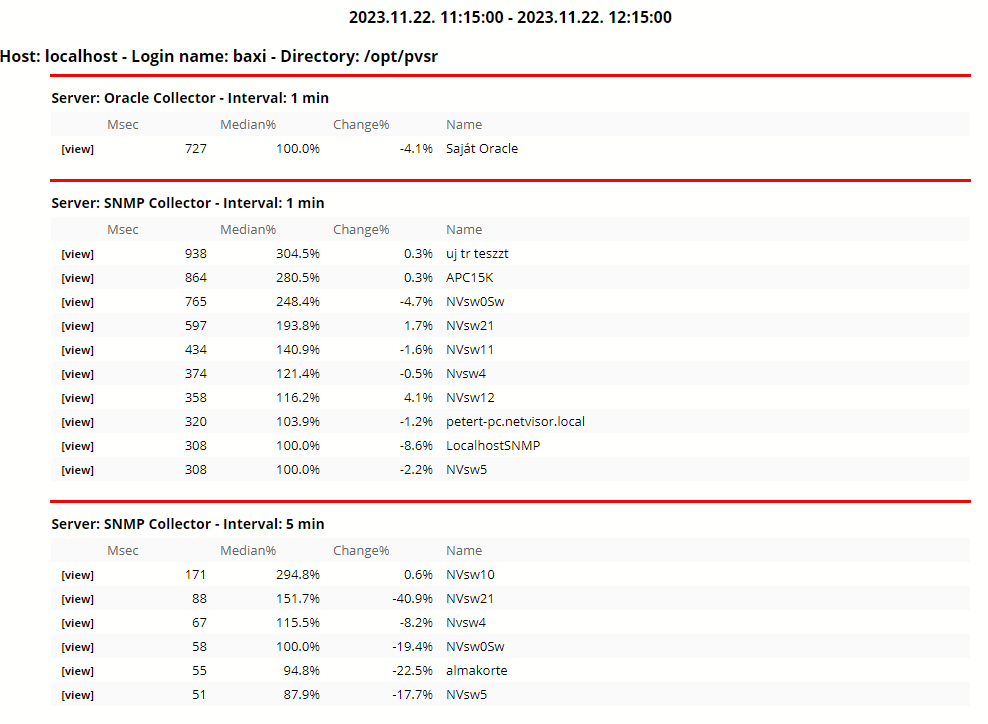
After clicking on the OK button the application collects statistics for the selected machines with the specified timespan and the configured topN setting. For each collector module – collection interval pair it displays the equipments which took the most time to collect data from:
· How many milliseconds it took to collect the data
· How this value relates to the median value for all equipments for this pair
· How this value relates to the value for this equipment as seen in the previous timespan. For example if the page shows values for the timespan 8am – 9am then the value is compared to the collection time in the 7am – 8am timespan
Each row contains a view link, which can be left-clicked or right-clicked on (for new PVSR tab) and brings up more detailed information about the equipment collection, see chapter 6.2.3.9 Data collection log and time stats