| Previous | 7.2 Measurement definitions | Next |
|---|
7.2.1 Viewing measurement definitions
The page displaying measurement definitions („Measurement definitions”) is located under the templates menu item (Settings=>Templates).
The measurement server type for which the measurements are displayed can be selected at the top of the page. In case of SNMP the referenced variables are always SNMP OIDs, where variables from the uploaded MIB can be used in the form of MIB-NAME::VARIABLE-NAME. In case of non-SNMP they are reference variables (e.g. ORA_TBL_SIZE for Oracle) returned by the given collector type.
There are two tables on the page: the first contains the measurement definitions whereas the optional second one the deleted definitions.
The fields of a measurement definition are the following:
· Measurement subtype: Short identifier of the type. Typically, it is some short (max 5-character) abbreviation in uppercase letters
· Description: Short description of the measurement. If no Descriptor OID (see later) is given, then by default this value also becomes the name of the measurement
· SysObjectID filter: Defined only for SNMP: If it is filled out, then the system tries to query the measurements of the equipment only if the sysObject ID of the equipment is identical or starts with the specified value.
· Unit: Label on the Y axis. In the label, the $INT variable can be used, which is substituted by the application with the textual equivalent of the measurement interval
· First formula, second formula: Every basic chart can display at most two measurements at the same time; therefore two formulas can be given for one measurement. If only one is needed (e.g. CPU measurement) then it should be the First formula, and the Second formula should be empty! The syntax of the formulae is discussed in the next subsection.
· Display name for the first value on the basic chart, display name for the second value on the basic chart: In case of basic charts, the system names one or two measurement values in the table under the chart as follows: if the type has one measurement value (formula), then it is called „Value”, if two, then they are called „In” and „Out”. With these two fields these values can be overwritten; for example, in case of the Netflow traffic measurement with the „Src->Dest” és „Dest->Src” values. Accordingly, it is not obligatory to fill out the field.
· Description OID: If it is given, then the system takes the description of the measurement from here. The values in the field depend on whether the measurement is of SNMP type or not. After the list of fields there are examples for the use of both the Descriptor OID and Name format fields.
o For non SNMP the variable returned by the data collector should be specified (for example, ORA_TBL_NAME for Oracle tablespaces)
o For SNMP one or more OIDs can be specified as a number or in the form of MIB::variable. If more than one OID are given, then they should be separated by spaces. In these cases, the system queries the equipment for each OID and forms the measurement description by concatenating them with spaces. For every OID the PORT notation can be used, in which case the system replaces the PORT with the index of the measurement and the obtained SNMP OID is used to get the description of the measurement. If the PORT notation is not used in the specified OID, then the system regards it as having an implicit “.PORT” suffix. Therefore, there is no need to use the PORT notation for normal SNMP tables; e.g. for an interface measurement the “1.3.6.1.2.1.2.2.1.2” or the RFC1213-MIB::ifDescr OID can be specified since extending this with the index of the interface we obtain the OID from which the interface description is obtained. The use of PORT notation is required only for certain equipment types where the corresponding values (measurement and description) are not stored in the same table but in separate variables.
· Name format: This value determines how the system should define the name of the measurement from the name of the measurement type and the obtained data. In the field, three specific values can be used that the system substitutes during the measurement name specification as follows:
o %DESCR_OID: the value obtained from the equipment with Descriptor OID
o %TYPE_DESCR: the name of the measurement type
o %INDEX: the index of the measurement
It is not required to specify this field, and if left blank, then the system uses the following values automatically:
o If there was a measurement name obtained from the equipment: %DESCR_OID %TYPE_DESCR
o There was no such, but the measurement is of table type (see below): %TYPE_DESCR %INDEX
o In all other cases: %TYPE_DESCR
After the list of fields there are examples for the use of both the Descriptor OID and the Name format fields.
· First formula format and Second formula format: Custom scripts can be specified to format the value of the first and the second formula when the values are exported into Excel or when the users view the value balloons on a JavaScript chart. There are three variables that can be used when processing a value:
o $VALUE: contains the value
o $TIME: contains the time in seconds
o $NAME: name of the chart element
The script will be ran as a Perl script and the subroutine strftime can also be used along with localtime to transform $TIME into a human readable date. The following example will interpret the collected data as time value in seconds and display the value as YYYY.MM.DD. HH:MI:SS:
return strftime("%Y.%m.%d. %H:%M:%S",localtime $VALUE);
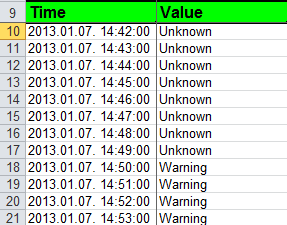
Figure 81. Excel export of a measurement type with value formatting
· Extended type: If its value is “Yes”, then when the user is using the equipment modification page then PVSR will not discover the measurement type by default. It is recommended to use this option if the measurement type is only rarely used and normally results in several measurement instances
· Table: If its value is “Yes”, then the measurement formulas, the Descriptor OID, the Multiplier OID and the Condition OID are not a given SNMP or another variable, but an SNMP or another table (similarly to the table containing interfaces). In this case, the program, for example, offers the 3rd element of the table only when the [Condition OID].3 value agrees with the condition value, the multiplier becomes the obtained value of the [Multiplier OID].3 variable, and the description the [Descriptor OID].3 value. For instance, for the ORA_TBL_NAME Oracle tablespace measurement the name of tablespace nr. 1 is in ORA_TBL_NAME.1.
· Counter: It can take three values:
o “Yes”: It is used when the measured value is accumulated continuously, but the speed of change per second is needed. The program divides the difference of the values of two measurements with the sampling time, and displays it. An example for this type is the interface traffic, and so it becomes bit/sec
o “Diff”: It is used when the measured value is accumulating continuously, but the difference is needed or the measured value changes very slowly (only whole values can be shown, consequently if the change is 100 unit, and the type was “Yes”, then the chart would not display anything because the integer part of 100/300 is 0). The program shows the difference of values for two measurements, and does not divide that with the sampling time. An example for this type is the interface error, so it becomes number/period.
o “No”: Always the current measured value is displayed on the chart. Differences are not calculated because the value can decrease as well. E.g. CPU measurement
If the measurement index (PVSR identifies a measurement in an equipment using the index) changes for a "Yes" or "Diff" counter type measurement then in the next collection cycle, but at least for 5 minutes PVSR will not collect data for that measurement, because due to the index change the previous and the new queried values do not belong to the same object. If the Counter is set to "No" then PVSR does not apply this method, unless the measurement calculation contains .PRE variables (see later)
· Max value: If the counter value is Diff or Yes, the measurement server should know the maximum of the measured variable, to be able to detect an “overflow”, namely what is the possible greatest value of the variable. This should be specified as an integer number. Accordingly, if for a Diff type variable the later measured value (y) is smaller then the earlier measured one (x), and the value of UPTIME (if the measurement server supports that variable) does not indicate a reboot, then the calculated value is not the negative value of y-x, but the value y-x+MAX_VALUE+1, which is consequently used for charts and reports. Therefore, if for example the measured value is a 32-bit octet variable and we wish to display the calculated traffic in bit/sec unit in PVSR, then the Counter type should be set to “Yes” and the “Max value” to (2^32)*8-1, i.e. to 34359738367. Besides the real maximum value, the value 0 can be also used, indicating that when the overflow occurs then PVSR should interpret that as counter reseting, rather than overflow, so in the example above it will display x instead of y-x+MAX_VALUE+1. The built-in interface measurements work in both ways: if PVSR uses the 32bit counters then it assumes overflow, but for the 64bit counters it assumes counter reset.
· Real-time settings: This controls whether the real-time monitoring is allowed for a measurement type or not. The fields are only shown if the collector type is capable of real-time monitoring. Each measurement type can either inherit the settings from the collector type itself of has its own settings. The values are the following:
o Allow real-time monitoring or not
o Only allow it for administrators
o Minimum for collection cycle
o Default collection cycle
o Stop after: default for the attribute with the same name
· Enum display mode: When a measurement type has a fixed set of possible values (for example some kind of a status measurement) then PVSR can be instructed to display the different result values as separate chart elements and to show on the chart the percentage of time the given value was seen. If the chart resolution is greater than or equal to the measurement interval then this percentage will obviously either 0 or 100. This mode is only available if the chart only contains one measurement and the measurement type does not have a second formula. When the enum mode is turned on then the real-time data collection feature is not available. We can specify the maximum number of distinct enum values to be displayed. If there are more distinct values then PVSR will display the ones with the lowest occurrence together as Others and use either an automatically choosen color for it or the color specified here. Additionally each value can be named using the [edit values] link and their color can also be manually set.
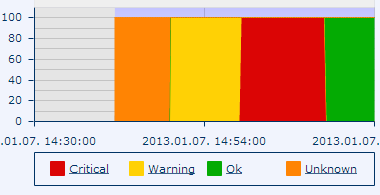
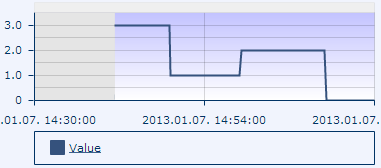
Figure 82. Chart with and without enumeration display mode
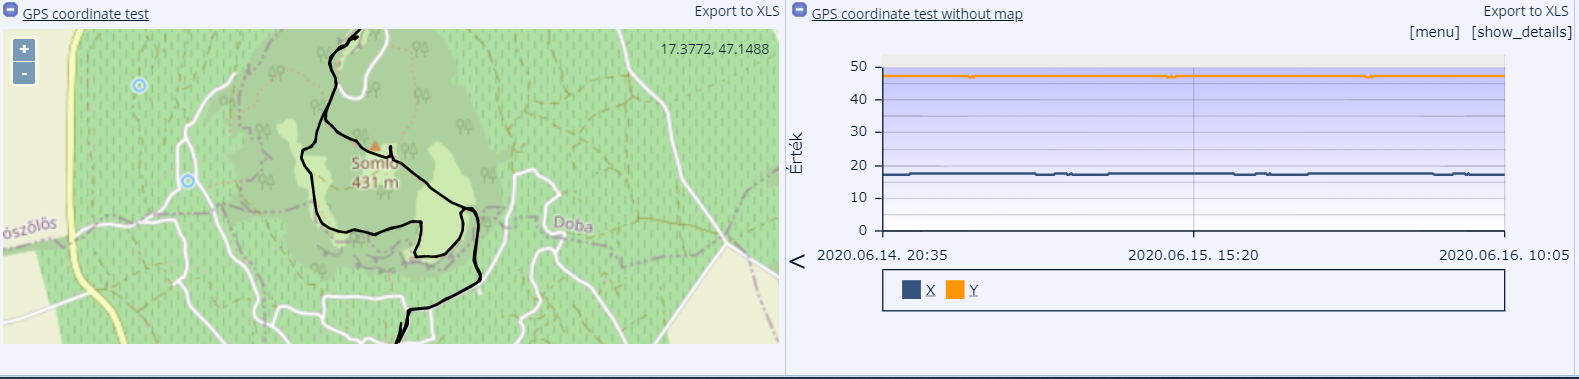
· Display on map mode: A measurement can result in X/Y coordinates in which case it is more meaningful to display the result on a map instead of two separate values on a chart. This behavior can be turned on with this option. Additional parameters can be configured if the option is checked:
o Coordinate system: currently only GPS / WGS84 is supported
o Display style: whether we want to see points or a path connecting them together
o Base map: currently only OpenStreetMap is supported
· Multiplier OID: If it is given, then the system uses it to obtain the quantity of the measured value. For example, when measuring the used disk capacity (1.3.6.1.2.1.25.2.3.1.6) its value is typically between 512-4096 depending on the measurement; accordingly, the measured 1 unit is in fact 512-4096 bytes. For SNMP the OID, in other cases the returned multiplier variable should be specified. The program uses this value (if it is bigger than 1) for two purposes:
o When drawing charts, this value is displayed in front of the legend of the y-axis (see later)
o On the page of a detailed measurement it is used for calculating the values under the chart (it multiplies the measured value with them)
· Condition OID, Condition value: If they are given, the program offers the measurement only if the queried value for the Condition OID is identical with the value written here. For example, the measurement of “Used disk capacity” and “Used virtual memory”, and a few other measurements apply the same “Input OID” (1.3.6.1.2.1.25.2.3.1.6 or HOST-RESOURCES-MIB::hrStorageUsed if the right MIB is uploaded). However, the program offers the virtual memory measurement only if the measured value at the set Condition OID of 1.3.6.1.2.1.25.2.3.1.2 or HOST-RESOURCES-MIB::hrStorageType equals “1.3.6.1.2.1.25.2.1.3” (here uploaded MIB variable cannot be used). For SNMP the OID, in other cases a returned condition variable should be specified here.
· Short description (URL): a URL may be specified. If it is filled out, then a Help label appears for the user on each chart during display, by clicking on which the page of the given URL pops up in a new window. Important: the editing and uploading of these pages is not part of the PVSR system!
When the form for a measurement type is displayed then we can test the formulas with the help of the [test] link next under the formula multi-line text area:
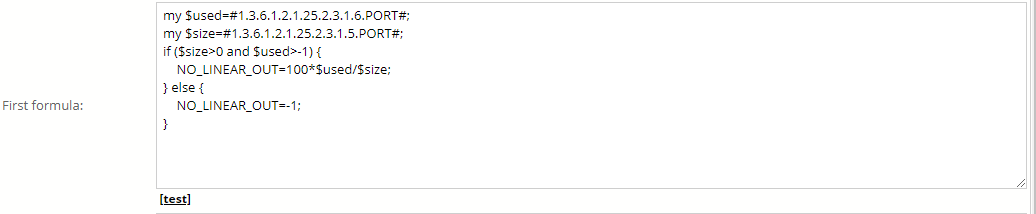
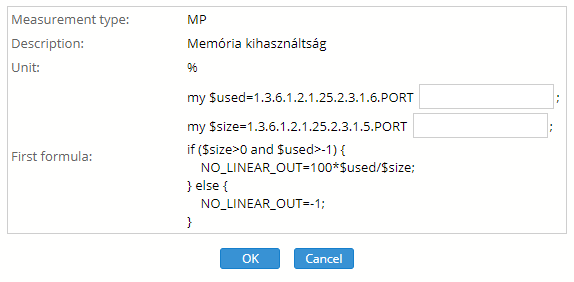
PVSR displays a form based on the formula where we can fill in the individual input values. If a parameter is present multiple times in a formula then PVSR will display multiple input fields but it will make sure that the same parameters always have the same values. Once all the parameters are filled in then we can test the formula with the OK button. Keep in mind that this only tests the formula, so even if the Counter parameter of the measurement type is set to Yes then it will only display one measured value and will not display the difference of two values divided by time. If the formula contains a syntax error or not all the fields are filled in then the system displays an appropriate error message.
Examples for the use of both the Descriptor OID and the Name format fields:
· The name of the measurement becomes „Physical Memory Used memory” if
o Measurement type: Used memory
o Descriptor OID: 1.3.6.1.2.1.25.2.3.1.3
o Value obtained from the equipment: Physical Memory
o Measurement index: 5
o Name format: empty
· The name of the measurement becomes „Used memory
o Measurement type: Used memory
o Descriptor OID: 1.3.6.1.2.1.25.2.3.1.3
o Value obtained from the equipment: Physical Memory
o Measurement index: 5
o Name format: %TYPE_DESCR %INDEX
· The name of the measurement becomes „Process CPU System Idle Process” if
o Measurement type: Process CPU
o Descriptor OID::
HOST-RESOURCES-MIB::hrSWRunName.PORT HOST-RESOURCES-MIB::hrSWRunParameters
o Values obtained from the equipment:
§ HOST-RESOURCES-MIB::hrSWRunName: System Idle Process
§ HOST-RESOURCES-MIB::hrSWRunParameters: zero
o Measurement index: 1
o Name format: %TYPE_DESCR %DESCR_OID
· The name of the measurement becomes „Process CPU svchost.exe -k imgsvc
o Mesurement type: Process CPU
o Descriptor OID:
1.3.6.1.2.1.25.4.2.1.2 HOST-RESOURCES-MIB::hrSWRunParameters.PORT
o Values obtained from the equipment:
§ 1.3.6.1.2.1.25.4.2.1.2: svchost.exe
§ HOST-RESOURCES-MIB::hrSWRunParameters: -k imgsvc
o Measurement index: 2184
o Name format: %TYPE_DESCR %DESCR_OID %INDEX