| Previous | 14.1 Specifics of measurement server types | Next |
|---|
14.1.12 Unix/Linux measurement servers
The Unix/Linux measurement server is an active and discoverable PVSR module. The measurement server takes into account the timeout value specified for the equipment, which is used to establish the SSH connection. Beside the basic attributes, the equipment has the following additional parameters (the code of the parameter is given in parenthesis; see Subsection 7.5.6 on Parameters of non-SNMP data collectors):
- IP address (UNIXLINUX EQ 1 IP): Single line text field, which can be seen by non-administrators as well. The field contains the IP address of the equipment, it is a mandatory parameter
- User (UNIXLINUX EQ 2 USER): Single line text field, which can be seen by non-administrators as well. The field contains the user name to be used for the connection, it is a mandatory parameter
- Password (UNIXLINUX EQ 3 PASSWORD): Single line text field, which cannot be seen by non-administrators. The field contains the password used to establish the connection, is not specified, then key based authentication is used to login to the remote machine
- Release (Z 02 RELEASE): The OS release information. Non-modifiable automatically discovered parameter
- System information (Z 03 UNAME): system information (uname). Non-modifiable automatically discovered parameter
- CPU (Z 04 CPUINFO): CPU information of the system. Non-modifiable automatically discovered parameter
- Memory (Z 04 MEMINFO): Memory information of the system. Non-modifiable automatically discovered parameter
- Swap (Z 04 SWAPINFO): Swap information of the system. Non-modifiable automatically discovered parameter
- IPv4 address(es) (Z 05 IPADDR): IP addresses of the system. Non-modifiable automatically discovered parameter
The measurement server uses basic programs through the SSH connection to perform the measurement. The measurement server supports the Solaris, IBM AIX and Linux operating systems.
Normally PVSR opens an SSH connection to each equipment in each collection cycle and closes the connection after it is done with the current cycle. This means that if the data collection cycle for an equipment is one minute then PVSR creates an SSH connections every minute and closes it. This behavior can be changed with the %SSH_PROXY_SIZE parameter in the CONFIG_INI.pm file. The keys in the hash are the data collection cycles in seconds and the value is a pool size. PVSR maintain maximum the given number of SSH connection. For example if this is the setting in CONFIG_INI.pm:
then if there are no more than 10 equipments with one minute data collection then PVSR only opens the SSH connection when it starts and do not close those during data collections (unless it detects an error). Optionally the %SSH_PROXY_PORT parameters can be set as well:
· The key is the same as for %SSH_PROXY_SIZE
· The value is the local TCP port used for communication between the data collector and the SSH pool. If not specified then the value is 38000 + data collection cycle in seconds
Example:
$SSH_PROXY_PORT{60}=12360;
A part of the Unix/Linux measurements are discoverable, and the other part are measurements that the user has to create manually. The measurements which can be discovered are the following:
· Free disc space (byte)
· Disc utilization (%)
· Disc reading and writing (byte/sec), only for Linux systems
· Temperature (Celsius), only for Linux systems
· CPU idle, system, wait and user (%): the value of the individual CPU utilization categories. For every category there are two measurement types: for the Solaris and the Linux operating systems the measurement contains the utilization for the entire measurement cycle, while for the IBM AIX it is based only on a few second collection.
· Free physical memory (byte)
· Physical memory utilization (%)
· Free swap space (byte)
· Swap utilization (%)
· Load factor 1-minute, 5-minutes and 15-minutes
· Runable processes (count): the number of processes of the user in runable state
· Logins (count): the number of logins the user has in the system
· All process (count): the number of processes the user has in the system
· Zombie process (count): the number of zombie process the user has
· All runable process (count): the number of processes in runable state
· All logins (count): the number of logins in the system
· All existing processes (count): the number of processes in the system
· All zombie processes (count): the number of all zombie process in the system
· Uptime
· Software RAID drive numbers
· NTPd state and peer offset
· Interface traffic, error and bond state
· Detailed Linux memory stats
· Inode usage
· NFS measurements
· Disk I/O in progress
· Disk average I/O read time
· Disk average I/O write time
· Disk I/O usage
There are several non-discoverable measurements:
· Process measurements: the system uses the value of the specified Index to search the currently running processes by name and/or argument and execute the measurement on them. The Index value can be in two formats. If it is in the format “-u=user -a=XYZ” then PVSR searches for processes run by the user “user” for which the “ps -e -o args” command matches the “XYZ” regular expression. Otherwise PVSR interprets the whole value of the Index parameter as the “XYZ” mentioned above. For example: if the Index is set to “-u=pvsr -a=command arg1”, then we obtain the number and CPU utilization of processes named “command” that are started with the “arg1” parameter and run by the user “pvsr”. If the value of the Index parameter is “command arg1” then we get every matching process, regardless of who has started them. The individual process measurements are:
o Process number: the number of process that matches the expression
o Process CPU usage: the total CPU usage for the matched processes
o Physical memory size of the process: the total physical memory size for the matched processes
o Virtual memory size of the process: the total virtual memory size for the matched processes
· Directory measurements: Index parameter of directory measurements are the absolute path of the directory. The library measurements are:
o Directory size
o Number of directory elements
· TNS ping measurements: PVSR uses the tnsping command to measure the Oracle server availability from that server. The Index parameter must be either <TNS_name> or <TNS_name><space><ping_count>
· DNS measurements: PVSR measures the DNS entry availability from that server. The Index parameter must be a DNS entry (FQDN for example)
· Number of open files: there are two measurement types. For the user open files the Index parameter must contain the name of the user, for the process open files the Index parameter must contain the file name of a pid file
· Custom command: the Index parameter must be the command. The measurement value must be in the first row of the output of the command and it must match the regular expression: (\d+(?:\.\d*)?|\d*\.\d+) This measurement is only allowed if the UNIXLINUX_ENABLE_CUSTOM_COMMANDS parameter is set to 1 in the CONFIG_INI.pm file. The command can contain references to equipment level user defined attributes in the form PVSR_UDA[attribute name code]. The system replaces this with the UDA’s value
As can be seen above, the Unix/Linux measurement server provides UPTIME data, and displays them too as a measurement.
During installation the measurement server also creates a “Default Unix/Linux” equipment template, which can be used to create all variables (with the exception of process measurements naturally). Furthermore, several chart templates are created as well:
- Unix/Linux Load factor: displays the three load values of a particular equipment as lines
- Unix/Linux free memory: the free physical and swap memory sizes of an equipment are displayed with superposed bars
- Unix/Linux CPU usage: displays the three CPU usage percentages of an equipment with superposed bars
- Unix/Linux processes: the number of executable and zombie processes of an equipment are displayed with superposed bars
- Unix/Linux processes of a user: the number of executable and zombie processes of a user on a piece of equipment are displayed with superposed bars
- Unix/Linux free disc space: the free space of all disks of an equipment are displayed with superposed bars
- Unix/Linux disk usage: the utilization of all disks of an equipment are displayed with superposed bars
PVSR offers several collector specific pages to aid the operators during their troubleshooting and diagnostic processes. For Unix/Linux equipments the following pages are available.
14.1.12.1 Processes
The page shows two tables: the first contains system parameters, like load factors and number of processes and the second contains all the processes running on the monitored server with the parameters:
· PID: process identifier
· Parent PID: process identifier of the parent process
· User: name of the user running the process
· CPU: used CPU in percentage. The column shows the CPU usage since the last page refresh, meaning that is empty when the page is first displayed
· Status: status of the process, for example Sleep, Running, Zombie
· Virtual memory and Physical memory
· Started: format is HH:MM:SS or DDD day(s) HH:MM:SS
· Command: the command with its arguments
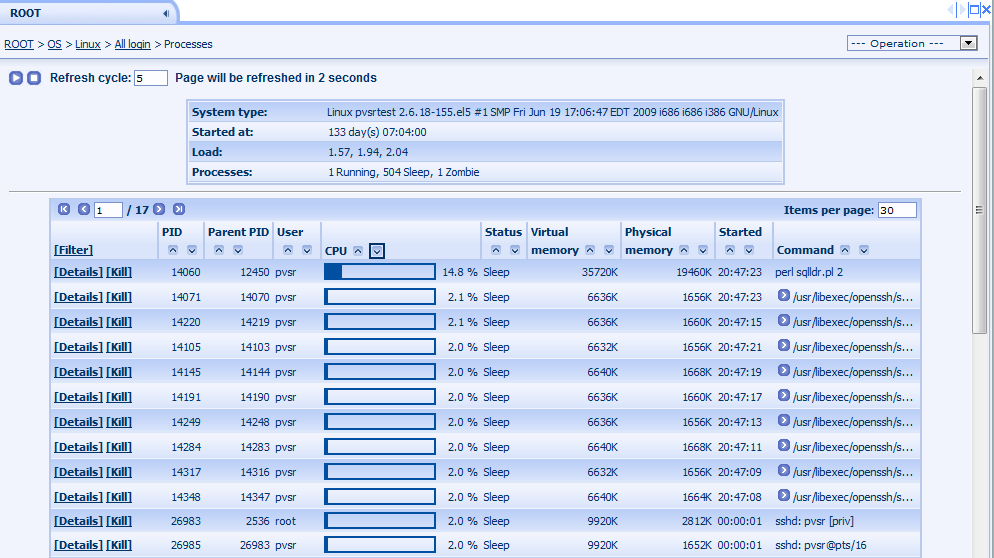
Figure 182. Unix/Linux collector page: Processes
The [Kill] link can be used to kill the given process. This page is only available for administrator users. The page shows the main process parameters and a table with the kill options:
· User name and Password: the user name and password to be used to kill the process. If the process is ran by the same user which PVSR is using to monitor the equipment then these fields are not shown. Otherwise the user can choose between the OS user running the process and the root user
· Signal to be used: which signal to send to the process
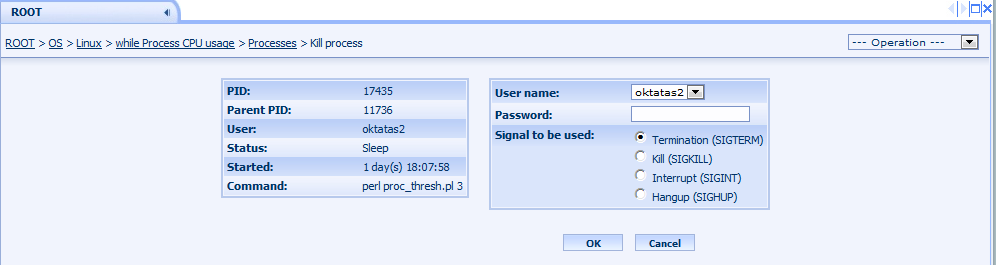
Figure 183. Unix/Linux collector page: Kill process
The [Details] link shows a page with a table showing the main process attributes, a link to the kill process page and two charts: the first shows the CPU usage and the second shows the physical and virtual memory usage. To empty the chart click on the [Empty charts] link
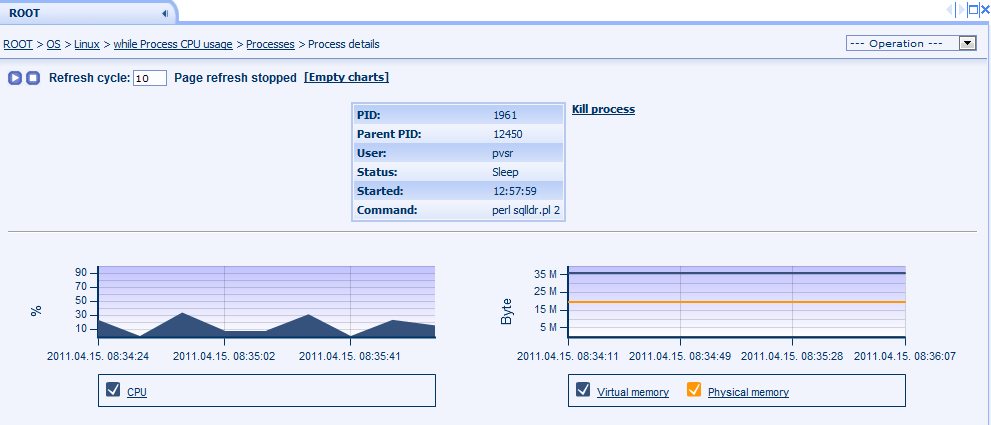
Figure 184. Unix/Linux collector page: Process details
14.1.12.2 Mounts
The page shows the mounted file system on the monitored server with their mount point and space usage:

Figure 185. Unix/Linux collector page: Mounts
14.1.12.3 Logins
The page shows all the logins:
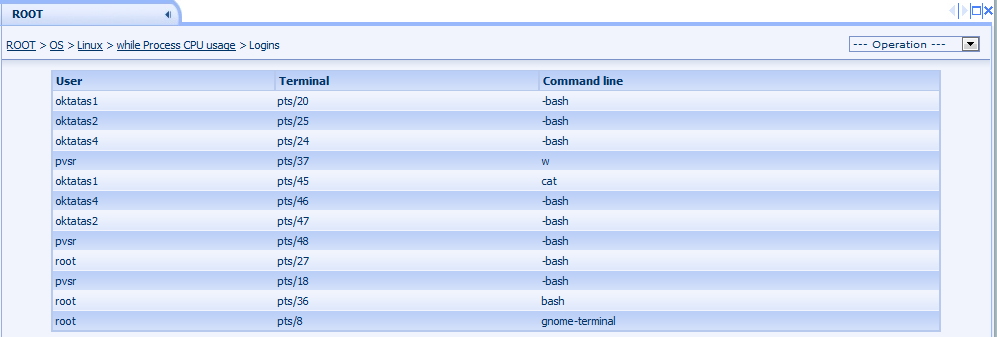
Figure 186. Unix/Linux collector page: Logins
14.1.12.4 Custom command
This page is only available for administrator users and only if the UNIXLINUX_ENABLE_CUSTOM_COMMANDS parameter is set to 1 in the CONFIG_INI.pm file. The page has two or three parameters: OS user to be used, its password (sometimes not needed) and the command to be ran. PVSR logs in, runs the command and logs out, meaning that if the user first runs the “cd mydir” command and then the “mkdir mydir2” command then the mydir2 directory will be created in the home directory of the OS user and not in the mydir directory. The user can specify multiple command in the Command field separated by ; and they will be executed in the same login session.

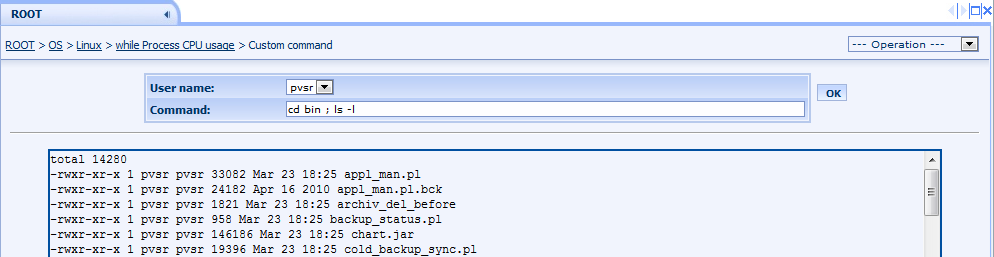
Figure 187. Unix/Linux collector page: Custom command