| Previous | 14.1 Specifics of measurement server types | Next |
|---|
The Microsoft SQL measurement server is an active and discoverable PVSR module used for the monitoring of Microsoft SQL database servers. The measurement server does not take into account the retry value specified at the equipment, only the timeout. Beside the basic ones, the equipments have the following attributes (the code of the parameter is given in parenthesis; see Subsection 7.5.6 on Parameters of non-SNMP data collectors):
· ODBC connection name (MSSQL EQ 1 DSN): PVSR connects to the database using ODBC. This parameter specifies the name of the configured ODBC DSN. Mandatory parameter
· User (MSSQL EQ 2 USER): the user name used for the connection. Mandatory parameter
· Password (MSSQL EQ 3 PASSWORD): the password used for the connection. Mandatory parameter
· Database (MSSQL EQ 4 DATABASE): the name of the database to be selected after the PVSR connected to the SQL server. The parameter is optional, if not specified then PVSR will use the user’s default database
· MSSQL version (Z 01 VERSION): the version of the database. Non-modifiable automatically discovered parameter
· Server (Z 02 SERVER): the server name on which the database is running. Non-modifiable automatically discovered parameter
Since PVSR collects statistics for the whole SQL server, it needs an SQL user with the VIEW SERVER STATE right. If we want to monitor SQL jobs as well then the user will need the SQLAgentReaderRole role as well. For example if the user name used for monitoring is “pvsrsql_monitor” then:
Use msdb
EXECUTE sp_addrolemember
@rolename = 'SQLAgentReaderRole',
@membername = 'pvsrsql_monitor'
PVSR contains several predefined measurements for the Microsoft SQL database, for the full list please refer to the Settings => Templates => Measurement type definition and select the Microsoft SQL entry from the drop-down list. New statistic parameter based measurement types can also be created. To achieve this the variables must be specified in the format „sysperfinfo|XXX|YYY.ZZZ”, where
· XXX: the Object name, for example Buffer Manager
· YYY: the Counter name, for example Page reads/sec
· ZZZ: instance name. If the statistic does not have an instance name then it must be left empty, but the trailing . character must also be present in this case. If the statistic has instances then either an instance name must be used or the PORT for multiple-instances PVSR measurement types (where Table is set to Yes).
In case of a multiple-instances measurement type the Description OID must be filled in with:
· If XXX is Databases then its value must be databases|name
· Otherwise instance_name|sysperfinfo|XXX|YYY
It also contains three non-discoverable measurements: Custom query (value), Custom query (diff) and Custom query (diff/sec). For each of them the user has to specify a select statement. The statement has to give back one row and one or more column in that row. PVSR will display the result of the specified column of that statement either as a value, as a difference between the current and the previous value or it can also divide the difference with the collection cycle.
PVSR also has a default Microsoft SQL equipment template which creates all the discoverable measurements and also offers several threshold templates by default.
PVSR offers several collector specific pages to aid the operators during their troubleshooting and diagnostic processes. For Microsoft SQL equipments the following pages are available.
The page is automatically refreshed. When it is selected from Operations then it waits a couple of seconds before returning so that it can show wait statistics. Later on it will display statistics since the last refresh. The page shows four tables: basic database parameters, important database hit KPIs, important database memory KPIs and sessions.
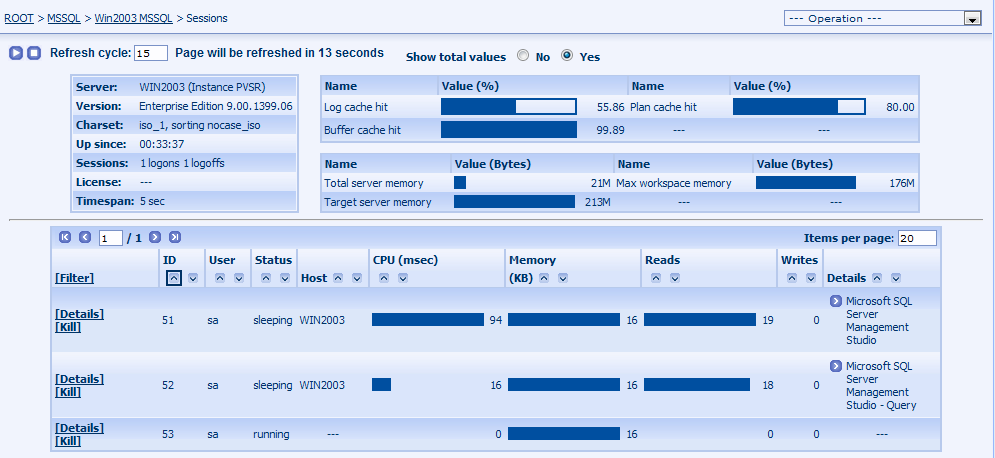
Figure 199. Microsoft SQL collector page: Sessions
The first table shows the name of the server, its version, character-set and ordering principle, how long it has been up and running, how many logons and logoffs occurred since the last page refresh, any license information (if exists) and the time since the last page refresh. The second and third tables show the hit and memory KPIs with their current values. The last table showing the sessions contains the following parameters for the sessions (depending on the server’s version):
· ID: the session ID
· User: the database user name connected through that session
· Status: the status of the session
· Host: the name of the host from which the connection originated (it might be empty)
· CPU: the CPU usage of the session in millisecundum. If the “Show total values” is set to Yes on the top of the page then the value is the total of the CPU usage since the session connected to the database, otherwise it shows the CPU usage since the last page refresh
· Memory: the memory usage of the session
· Reads: the number of reads performed by the session. Similarly to the CPU column: If the “Show total values” is set to Yes on the top of the page then the value is the total of the reads since the session connected to the database, otherwise it shows the reads since the last page refresh
· Writes: the number of writes performed by the session. Similarly to the CPU column: If the “Show total values” is set to Yes on the top of the page then the value is the total of the writes since the session connected to the database, otherwise it shows the writes since the last page refresh
· Details: by default it shows the name of the program used to connect to the database. If opened it also shows the logon time, the processs ID of that program, the last time the session sent any call to the server and the elapsed and scheduled times. The last two parameters behave similar to the CPU/read/write parameters: If the “Show total values” is set to Yes on the top of the page then the values represent the total values, otherwise the value since the last page refresh
The Details link in each row can be used to get a more detailed page for that particular session. This page shows similar information to the ones mentioned above, except that it shows the KPIs on charts and also shows the current and previously executed SQL statement:
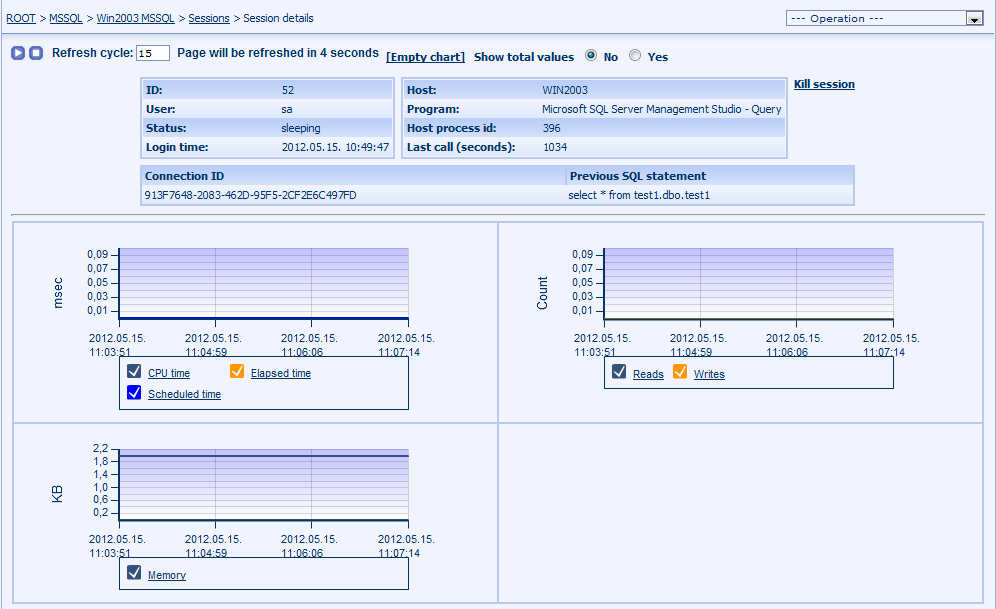
Figure 200. Microsoft SQL collector page: Session details
The Kill session link on this page as well the kill link on the Sessions page can be used to terminate the session.
The page shows the sessions which are blocking each other. For each blocking-blocked pair it shows the main session information (ID, user and host) and also the SQL statement being executed.
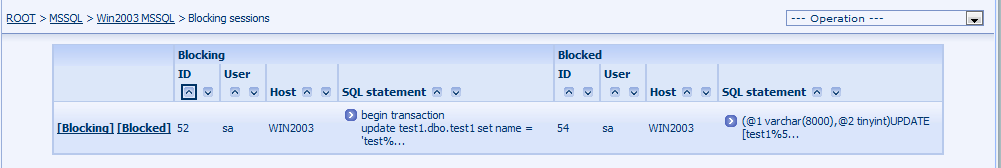
Figure 201. Microsoft SQL collector page: Blocking sessions
The Blocking and the Blocked links can be used to switch to the session details page from which the session can be killed if necessary.
The page shows the databases in the Microsoft SQL server:
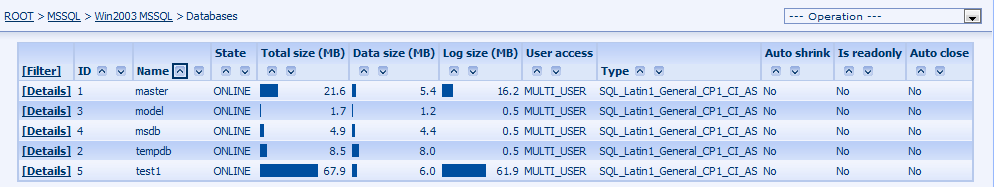
Figure 202. Microsoft SQL collector page: Databases
The Total size is the sum of the Data and Log size parameters. The Details link shows the tables in that database with some of their parameters and space usage:
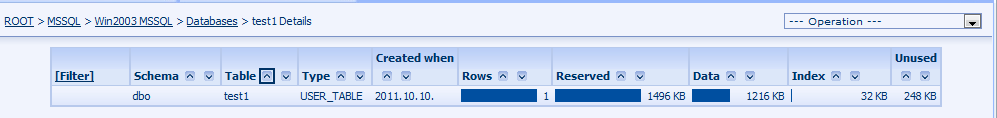
Figure 203. Microsoft SQL collector page: Database details
The page is automatically refreshed and shows every statistic values in the database. For each item it shows its value as well the value change since the last page refresh. The Monitoring link can be uses to select a particular statistic and show its value and the value change on charts:
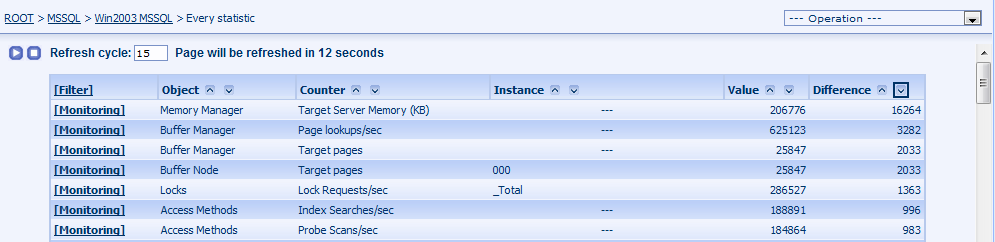
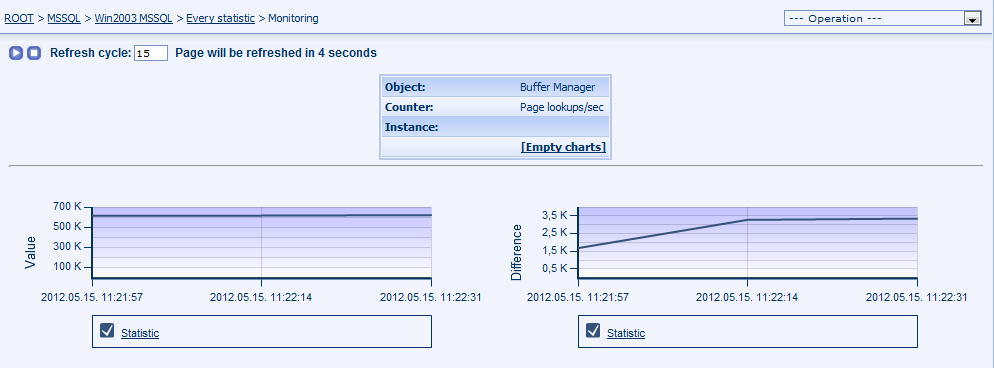
Figure 204. Microsoft SQL collector page: Every statistics and statistic details pages
This page is available only to administrator users. The user can specify any select statement and the page shows its result in a table:
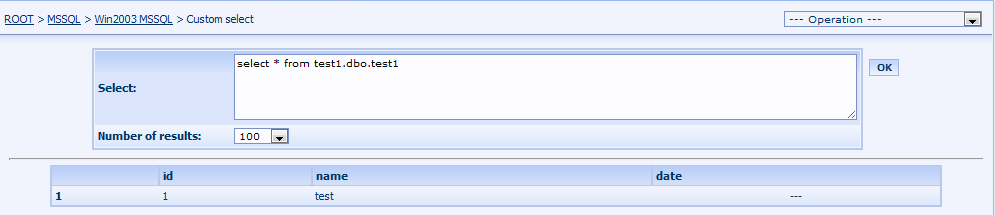
Figure 205. Microsoft SQL collector page: Custom select