| Previous | 14.1 Specifics of measurement server types | Next |
|---|
14.1.30 Telemetry measurement servers
The Telemetry measurement server is an active and discoverable PVSR module which does irregular (non-periodic) measurements: it receives telemetry messages from equipments, using one of the following methods:
· Cisco MDT messages over UDP or TCP protocol
· Cisco MDT messages in GRPC messages over HTTP2
· gNMI telemetry notifications over HTTP2
PVSR can work with or without SSL encryption if HTTP2 is used (both in case of Cisco MDT and gNMI). If SSL is used then the CISCO_MDT_GRPC_CERT_FILE, CISCO_MDT_GRPC_KEY_FILE and CISCO_MDT_GRPC_CERT_PASSWORD parameters must be set. In case of Cisco the SSL certificate file must be copied onto the device into the /misc/config/grpc/dialout directory. The PVSR installation comes with a pregenerated SSL certificate file (pvsr_grpc_cert.pem) which can be used for this purpose.
The method of data collection differs considerably depending whether Cisco MDT or gNMI is used.
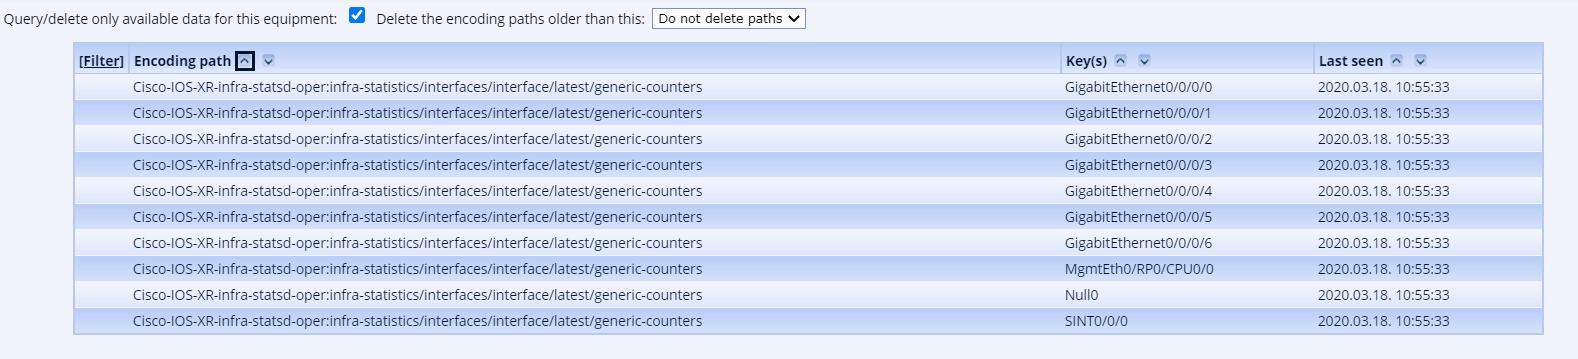
In case of Cisco MDT the application is able to receive the telemetry in several encoding: GPB, JSON and Self-describing-GPB (known otherwise as GPBKV). The data collector starts listening on the ports specified by the CISCO_MDT_UDP_PORT, CISCO_MDT_TCP_PORT, CISCO_MDT_GRPC_WITH_SSL and CISCO_MDT_GRPC_WITHOUT_SSL parameters and automatically detects the encoding used in the communication. The sending of telemetry must be configured in the Cisco device manually, this is outside of the scope of PVSR. The data collector maintains a cache containing all the Cisco MDT telemetry sensor paths and keys it received anytime in the past for two purposes. It uses this cache to discover the available measurements when someone opens the equipment for configuration, which means that it is recommended to configure the Cisco device before creating it in PVSR. It also uses this cache to make the life of the PVSR administrators easier: the application has a Telemetry collector page especially for the Cisco MDT devices, called “Cisco MDT available data”, which shows the different sensor paths and keys received from the device. When the "Query/delete only available data for this equipment" is not checked then it shows every sensor paths and keys seen from any devices. This option is useful if we are not sure about the configured MDT identifiers. This page can also be used to delete these cache entries.
Since PVSR only listens for incoming messages, the Cisco devices must be able to connect to the collector via the specified protocol and port.
In case of gNMI telemetry the collector uses the specified credentials to subscribe to telemetry updates. This means that only the gNMI protocol and optional SSL credentials must be configured in the monitored device before it is created in PVSR. The collector tests the available measurement types during discovery by subscribing to the variables in the measurement types. The gNMI equipments also have a collector page, called “gNMI capabilities” which displays the response to the Capabilities gNMI call. Since PVSR starts the communication it must be able to connect to the monitored device via the specified port.
The format of the variables in the measurement types depends whether the equipment is a Cisco MDT with GPB encoding or not (any other Cisco MDT or gNMI). The reason for this is that in the case of MDT with GPB the collector needs additional information to decode the telemetry message.
Cisco MDT with JSON/GPBKV or gNMI:
The variables must be in the format <XXX>:<YYY>:<ZZZ>, where the <XXX>:<YYY> part is referred to in the Cisco MDT terminology as sensor-path or encoding_path and in the case of gNMI the <XXX> part is referred to as path origin and the <YYY> part as path elements. However in both cases the <XXX>:<YYY> part together means the same thing: a point in the variable tree, under which the desired parameters can be found. The <ZZZ> part points to the particular parameter. Both the <YYY> and the <ZZZ> parts might have additional structures: elements separated by the “/” character. The meaning of these parts is protocol dependent:
· In case of Cisco MDT each <XXX>:<YYY> combinations means a particular MDT message type as defined by the .proto file in this repository: https://github.com/cisco/bigmuddy-network-telemetry-proto, and the <ZZZ> part points to a parameter in the message structure defined in the .proto file
· In case of gNMI the collector subscribes to telemetry updates with the <XXX>:<YYY> path and the elements in the <ZZZ> part points to a parameter in the received message
Although the interpretation is not exactly the same, however the same <XXX>:<YYY>:<ZZZ> value can be used for both Cisco MDT and gNMI. Sometimes a variable can have multiple instances in the same equipment, similar to the Table=Yes PVSR measurement types. In these cases the “.PORT” part in the PVSR measurement type refers to the different key values. Examples:
Cisco-IOS-XR-infra-statsd-oper:infra-statistics/interfaces/interface/latest/generic-counters:bytes-received
Cisco-IOS-XR-wdsysmon-fd-oper:system-monitoring/cpu-utilization:total-cpu-fifteen-minute
and a complete measurement calculation example:
my $nowV=#Cisco-IOS-XR-wdsysmon-fd-oper:system-monitoring/cpu-utilization:total-cpu-fifteen-minute.PORT#;
if ($nowV>=0) {
NO_LINEAR_OUT=$nowV;
}
Cisco MDT with GPB encoding:
In the case of GPB encoding the message decoding cannot be done without knowing some part of the message specification as present in the .proto file. The content of the <ZZZ> part is different: it contains numeric identifiers and type specifications instead of parameter names, but it still can have many elements separated by the “/” character. Generally the <ZZZ> part looks like this:
<zzz1>/<zzz2>/…/<zzzN> or <zzz1>/<zzz2>/…/<zzzN>[type=<typeN>]
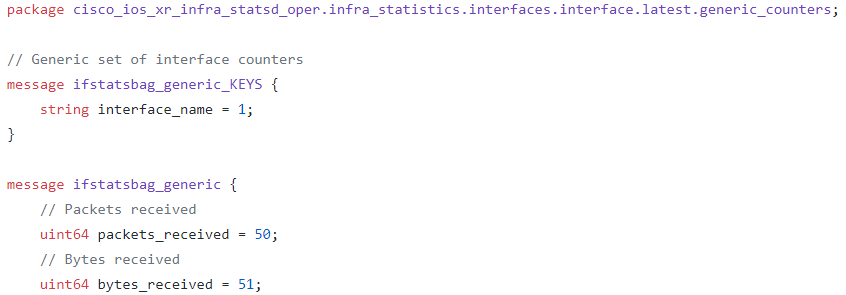
The parts up until the last one mean “go down in the tree to this element” and the last part (a “leaf”) means a parameter with the type uint64 if not specified or with the type <typeN>. For example the bytes-received variable in the first example looks like this in case of GPB:
Cisco-IOS-XR-infra-statsd-oper:infra-statistics/interfaces/interface/latest/generic-counters:51
or if we want to exactly specify the type of the variable then as
Cisco-IOS-XR-infra-statsd-oper:infra-statistics/interfaces/interface/latest/generic-counters:51[type=uint64]
because the message .proto file (https://github.com/cisco/bigmuddy-network-telemetry-proto/blob/master/proto_archive/cisco_ios_xr_infra_statsd_oper/infra_statistics/interfaces/interface/latest/generic_counters/ifstatsbag_generic.proto) has this specification:
The equipment configuration parameters are also different based on whether the collector server uses Cisco MDT or gNMI, and the Timeout parameter is only meaningful in the case of gNMI.
· Type (TELEMETRY EQ 1 TYPE): the type of the data collection, Cisco Model Driven Telemetry, gNMI without SSL or gNMI with SSL
· In case of Cisco MDT:
o Cisco MDT node id (TELEMETRY EQ 2 NODE_ID_STR): the MDT identifier as configured in the Cisco device (hostname), mandatory parameter
· In case of gNMI:
o gNMI host (TELEMETRY EQ 3 HOST AND PORT): the host and port to which PVSR must connect to, mandatory parameter. The format is either <ip_or_host>:<port> or just <ip_or_host> in which case PVSR uses the port 57400
o gNMI sample (sec) (TELEMETRY EQ 4 SAMPLE): optional parameter, if set then PVSR subscribes with the SAMPLE subscription mode meaning that if wants to receives new value every given seconds, even if the value does not change. If left empty then PVSR subscribes with the ON_CHANGE subscription mode meaning that it only wants to receive a notification if a value changes
o gNMI additional connection parameters (TELEMETRY EQ 5 ADDITIONAL HEADERS): optional connection parameters. If specified then it must be in the format of “<key1>=<value1>, <key2>=<value2>, …” and each pair will be placed in the HTTP2 request header. For example in case of Cisco devices: “username=my_gnmi_user, password=my_gnmi_password”
For more information about telemetry please go to these sites:
· gNMI specification: https://github.com/openconfig/reference/blob/master/rpc/gnmi/gnmi-specification.md
· Yang model files for gNMI: https://github.com/YangModels/yang
· Cisco MDT: https://github.com/cisco/bigmuddy-network-telemetry-proto/