| Previous | 5 Server configuration and management | Next |
|---|
5.6 Collector load
Both the admin user and the administrator users can reach the Collector load page. The page displays (besides the major data of the individual measurement servers) the size of the data files created by the servers and the total number of equipment and measurements performed by them.
By clicking the view link in the first column, the page under the menu item of Settings=>Measurements=>Summary will be displayed, filtered by the selected measurement server. The scroll down menu in the import statistics column contains all possible measurement times, independently from the fact whether a measurement of that interval currently belongs to the given measurement server or not (since the query examines data collected earlier, too), but as a hint it indicates the current time intervals in green color, and for these it also displays the number of measurements running with that interval After selecting the interval, the statistics page is automatically displayed. The output of the statistics shows the number of measurements loaded into the database for each collection cycle as well the number of seconds the data loading took.
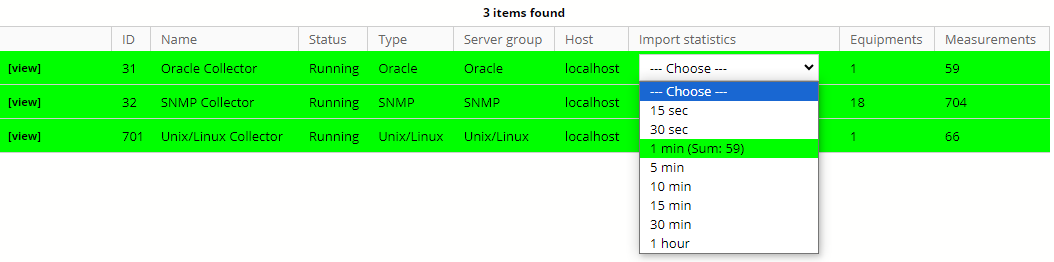
Figure 18. Collector load
| |
|
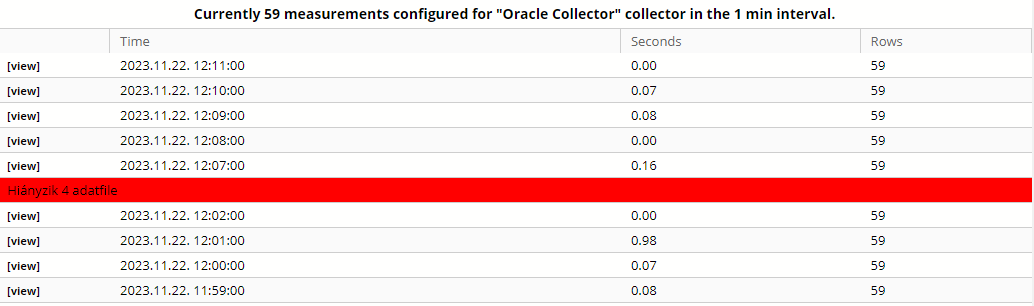
Figure 19. Collector load statistics
The collector server statistics is created in the tmp/done directory on the computer where the SQLLDR program is running. According to this, the statistics are kept till they are compressed and/or deleted by the Application manager (see the MTIME… variables in the CONFIG_INI.pm).
At the statistic menu item you can view the list of measurements that were unsuccessful at a given time by clicking on the view link. After that the list of devices and measurements are displayed together with another link that opens to the configuration panel of the given device.