| Previous | 5 Server configuration and management | Next |
|---|
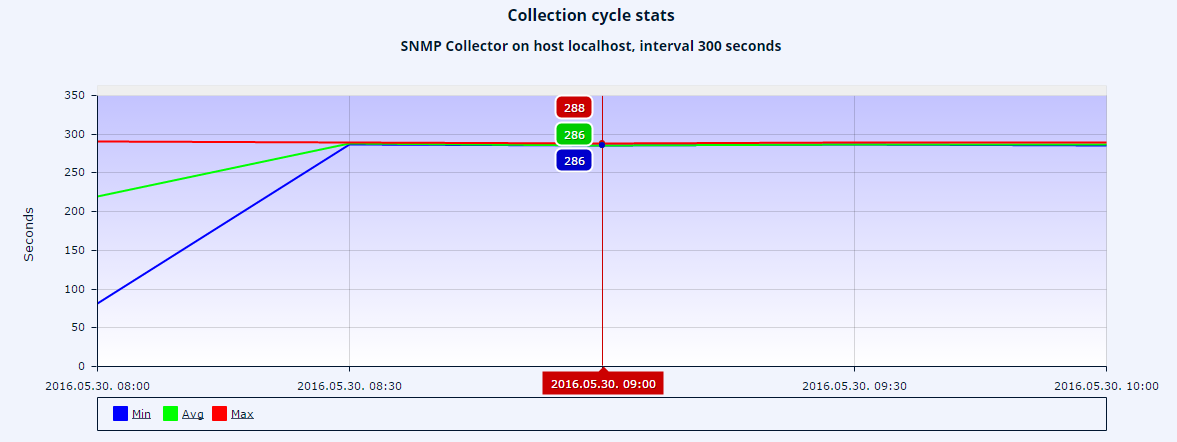
5.10 Collection cycle stats
The page is similar to the collector load page: it shows the data collector servers in PVSR and their different collection cycles. However this page only shows the active data collector types with PVSR scheduling (SNMP, Oracle, …) and not the ones without the scheduling (Netflow, EthernetOAM, …). For these data collectors the system starts the data collection at every collection cycle, and ideally waits some seconds after the data collection is finished. However if the data collection takes too much time then PVSR is not able to finish it and eventually there will be data loss in the system. In such a case the administrators have to modify the equipment parameters (less timeout), increase the number of processes doing the data collection or add additional collector servers to the server group.
This page can be used to analyze the system in this regard. When the user selects a collection cycle then the page shows the number of seconds left at the end of the collection cycle. The chart contains value for every half an hour, showing the minimum-average-maximum or if the collection cycle is greater than half an hour then the chart shows value for every two hours. The chart may show negative values in case PVSR wasn’t able to finish with the data collection cycle in time.