| Previous | 6.2 Site and equipment configuration | Next |
|---|
6.2.6 Public and private charts
6.2.6.1 Editing charts
Administrator and restricted administrators can edit private and public charts, while admin users can edit only public charts and every other user just private charts. The editing of both types takes place on pages structured almost identically; therefore, both of them are discussed in this chapter, while indicating the minimal differences between them.
The editing of charts is accessible under the “Settings=>Templates=>Public charts” and “Settings=>Templates=>Privat charts” submenu items. Both of them are also available through the “Settings=>Site and equipment configuration” page, if not a virtual site or equipment is selected in the hierarchy. This case differs from a menu based direct access in the following points:
· It is not necessary to specify the site and equipment name filter conditions when creating a new chart because the results are filtered automatically for the object at which the user started editing the chart.
· There is a back link on the starting page, which leads back to the appropriate site or equipment.
· Similarly to the Site and equipment configuration, both our location in the site equipment hierarchy as well as a pull down menu with the usual operations appear on the top of the page.
· If the chart template configuration is opened from the equipment page, then for the template based creation of new charts the system automatically offers the names of the equipment and template together for chart name. However in the other case only the template name will be offered, which in general will not be unique in the system without modification (see below)
· If the chart template configuration is opened from the equipment page, then it is possible to use all chart templates at the same time, which means that we can create all charts for the equipment templates in one step
· If the chart template configuration is opened from the equipment page, then it is possible to filter and to show only those charts which have an measurement element belonging to the equipment
The chart configuration page can be opened for a specific chart from the virtual equipment page as well.
The starting page contains the list of private or public charts together with the following attributes:
· Editing links:
o [add new]: creates a new chart
o [copy from]: creates a chart based on another one. Both in the private and the public cases, users can choose from the list of their private charts and the public charts that they have access to
o [from template]: creates a new chart based on a template (see next subsection)
o [from each templates]: creating new charts from templates (see next subsection) appears only if the chart creation is initiated from the equipment page
o [edit]: edits the chart attributes that are displayed here
o [
o [members]: edits the members of the chart
· Name: the name of the chart. For public charts, it should be unique among the public charts, and for private charts it should be unique among the public and private charts. Accordingly, a public chart can be created with a name that already exists under the private charts of the user, or the same chart name can appear in the set of private charts belonging to many different users
· Created by: The name of the chart designer, naturally it is used for public charts only
· Unit: description of the value axis of the chart
· Minimum: The chart minimum as a percentage or a concrete value. If it is not given, then the minimum value is at
· Maximum: The chart maximum as a percentage or a concrete value. If it is not given, then the maximum value is the current maximum value displayed in the chart. A percentage value is interpreted with respect to the average of the values displayed on the current chart
· Limit the number of displayed elements: Should the chart display every element or should PVSR look for the TopN elements and display only those. If the user chooses this option then he can also specify the maximum number of displayed elements. The sum of the remaining elements will be displayed as Others with the specified color
· Summary: Should aggregate measurement values be calculated in the table that corresponds to the chart? It can be turned on only if the chart has no element for which the Zero value (see below) is set to the previous zero value. Moreover, if it is turned on and such an element is created during chart modification or creation, then it is turned off automatically.
· Short description (URL): This field is displayed only for administrator users. In this field a URL can be specified. If it is set, then for each chart a Help sign appears for the users when the chart is viewed, and when this link is clicked on, then the page pointed by the given URL is displayed in a new window. Important: the editing and creating of these pages are not part of the PVSR system!
In case of creation and modification the same fields are displayed (filled out with values for modification). Beside the above fields, the administrator and the restricted administrator users can also change whether the chart is public or private.
6.2.6.2 Chart members
Under the [members] link is the list of chart elements of the current chart. The items of this table are the following in order:
· Editing links:
o [add new]: creating a new element
o [edit]: modifying an element
o [
· Order: The order of the element within the chart. The order not only determines the drawing order of the elements on the chart but it also influences the reference point of the chart base explained later. The order can be modified on this starting page with the green down and up arrows or on the element edit page ([edit] link)
· Name: The name of the element, which appears in the table of values on the chart
· Object: The object for which the element contain data. For chart elements the object can be a basic site or basic equipment report. For measurement chart elements it can be an interface or other measurement.
· Threshold or report variable: Depending on the type of the element (report or measurement) it contains the name of the threshold violation or the report variable to be displayed
· Field: Which measured value belonging to the object, and optionally to the report variable, should be displayed by the chart element:
o For measurement chart elements this can be an input or an output
o For report charts this can be minimum, maximum, average, etc.
· Type: The representation of a chart element should be a line, an area or a bar
· Chart base: Selects the chart base of the chart element. With the exception of the first element (where naturally the 0 value necessarily corresponds to the zero) it is possible to choose, whether the chart base of the chart element should agree with the current chart base of the previous chart element (chart elements will be stacked) or with the current value of the previous chart element (chart elements will not be stacked). Although the software allows it, it isn’t recommended to have the two modes on the same chart. The following example shows the two different diagrams for the same value pair.
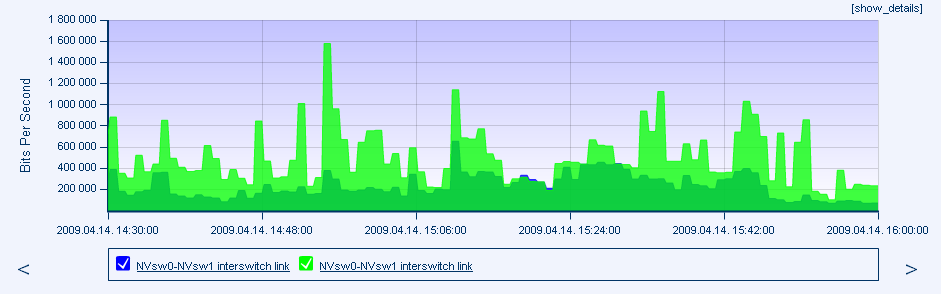
Figure 30. Chart I: Common chart base
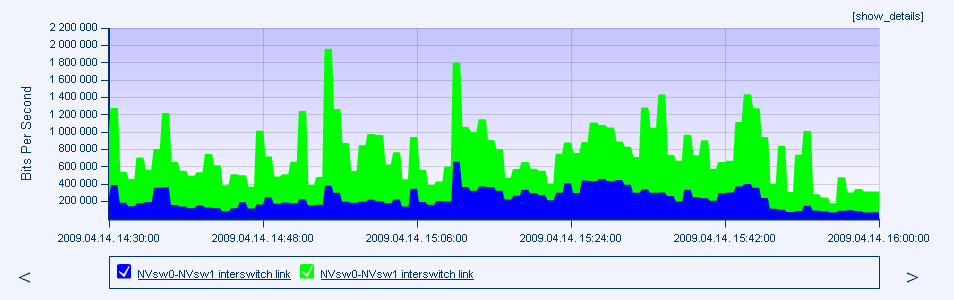
Figure 31. Chart II: superposed elements
· Color: element color
· Peak color: If the chart resolution (e.g. 5 minutes, 2 hours, etc.) is smaller than the value resolution (e.g. 1 minutes, 5 minutes, etc.) then the application shows the calculated average on the chart (both on the chart defined here and on the default one). If a color is set here, then beside the average values the maximum values of the data are also displayed.
· Transparent: whether the other possible chart elements behind the element should be visible. Its use is recommended if the type of the element is area or bar, and the value of the zero point parameters is not “previous value” but “previous zero”
· Assume zero when value is missing: If there is no measurement value at a given time, then the application can draw the chart according to the last value, or assume the missing value to be zero.
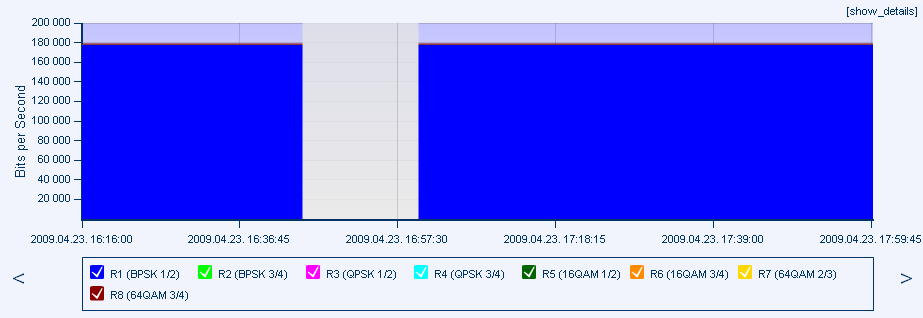
Figure 32. Chart III: assume zero when value is missing
A new element is created in two steps: first, the type of the element has to be choosen from one of the following: measurement, report variable or advanced chart member. The second steps differ more or less from each other depending on the type selected in the first step.
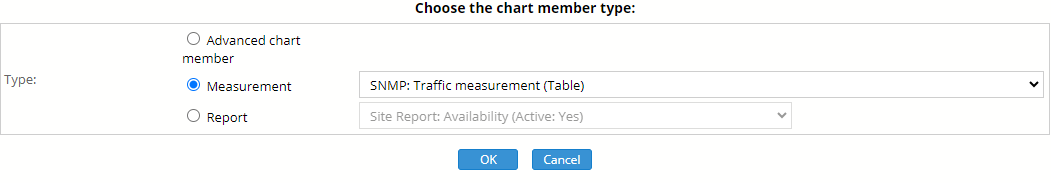
Figure 33. Chart member type selection
Adding new measurement element
The following configurable elements appear from the list mentioned above: name, object and threshold, field, type, chart base, color, peak color, transparent and zero value. The order does not appear because the new element receives the last sequence number automatically. The user can select the measurement with the help of three pull down items: site, equipment and measurement. The equipment pull down menu always displays the list of equipment directly under the currently chosen element in the site menu, while the measurement menu always shows the measurements under the currently selected equipment. When the selection of the pull down menus is changed, the page reloads automatically to reflect the current status. Finally, the desired element can be selected with the help of the “OK” button; however, this appears only if all the necessary object pull down menus have been displayed according to the report variable or measurement selected in the first step. For example, when measuring communication traffic, this button appears only if a piece of equipment on a site and a measurement under that have been selected.
Adding new report variable element
If the selected report variable is at site level then only a site pull down will be displayes and if it is at equipment level then the site and the equipment selection will be shown and the threshold selection is not present.
Adding new advanced chart element
Advanced chart elements are arbitrary calculations based on different measurements. PVSR allows to use any type of measurement in the same advanced elem and not even the measurement cycles must be the same. There are some features which aren't supported for this element types: the user will only be able to select the Peak chart option if he is using the JavaScript based charts and not the image based charts. These charts won't be shown under the Alarms menu, unless switched directly to it from the Measurement menu.
The user cannot set a threshold for this type of element and the object selection differs also.
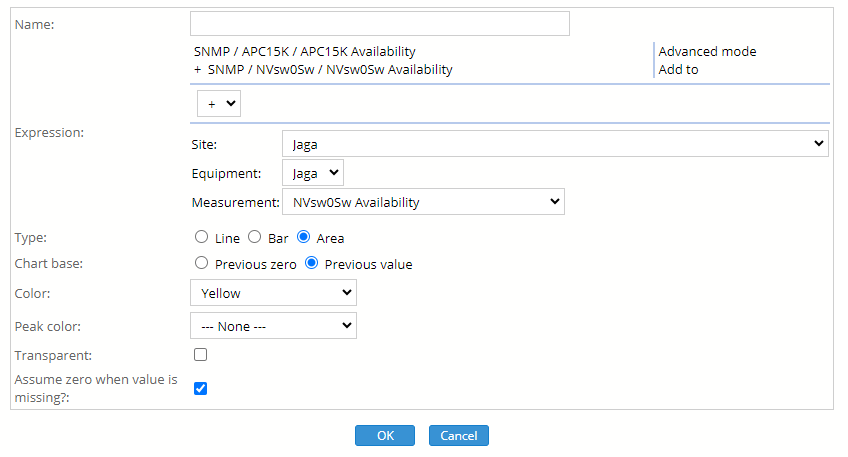
Figure 34. Advanced chart element configuration - Simple mode
As shown above, the user has to create an expression and PVSR will calculate its value when showing the chart. There are two modes to edit the expression: Simple mode and Advanced mode. When using the Simple mode, the user can select the measurement the same way as if he would add just one measurement to the chart, select the operation if the expression is not empty and click on the "Add to" link to add the measurement to the expression. To delete an measurement from the expression the user only has to click on a measurement in the expression and the application will remove it (although the mosue cursor cannot be seen on the screenshot above, it is placed over the second measurement in the expression, this is what the underlining is showing).
Although this is a very easy way to edit the expression, the user can only use the plus and minus operators. To create an arbitrary expression, the user has to switch to Advanced mode by clicking on the link above "Add to".
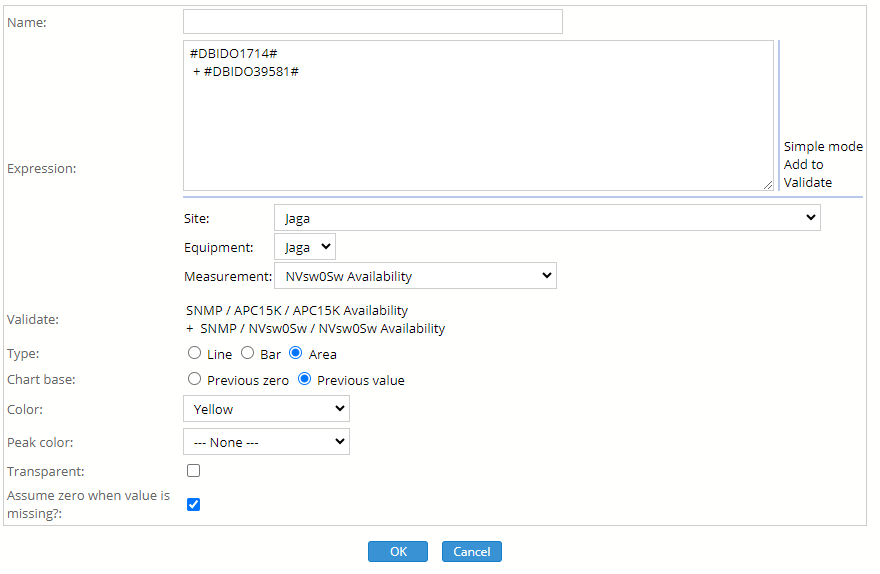
Figure 35. Advanced chart element configuration - Advanced mode
The advanced mode has a freely editable text field. If the user clicks on the "Add to" link then a string representing the measurement will be added to the text field but the user has to make sure that the end result will be meaningfull. For example adding two measurements without any operator between them will result in an error and the user won't be able to save it. Since in this mode the user can create an invalid expression, there is a link called Validate: when the user clicks on it then the application will check the expression (without saving the changes) and either display a textual representation in the Validate row or display an error message in the same row. The user cannot switch back to Simple mode until the expression has been validated without an error. The user can use mathematical operators in the expression, like + - * / and parenthesis.
For users with Perl programing language experience: the #DBID…# parts will be replaced with the actual measurement values and the whole expression will be evaluated as a Perl expression with the eval function. So for example the following will show for each time the maximum of the two measurements:
my $one=#DBIDF1296285.IN#;
my $two=#DBIDF1296286.IN#;
($two>$one?$two:$one);
Modification and deletion
When modifying already existing elements, the same fields are displayed with the only difference that the name of the previously selected object in the object field cannot be changed except for advanced elements.
A chart element deletion can happen automatically, and not just with the [del] link:
· If the user is not administrator and his rights to an object are revoked, then the corresponding private chart elements are deleted too.
· If the object is deleted then it is automatically removed from all chart definitions too. If a chart becomes empty after such an operation, then the chart is deleted automatically as well.
6.2.6.3 Template based creation
The initial creation of charts with the above mentioned procedure may consist of many steps. To facilitate this process, the administrators of the system can create chart templates too, which can be used with the “from template” editor link on the start page. In this case, the creation involves at most three steps:
· Template selection: Chart creation starts on the equipment page, where only those templates can be selected that match the type of the equipment. If there is only one possible choice, then this step is performed automatically
· Basic data specification: the basic data used for the normal creation of charts should/can be specified. The value of the name field must be specified, which is automatically set to the name of the template by the system if the editing does not start on the equipment page. If it starts there, then the system writes the names of the equipment and template after each other. However, the administrator could have decided when creating the template that he/she fixes the other values as well. If the template is such, then it is also possible to search for the name of the site, equipment and measurement. When searching, the symbol % matches an arbitrary number of (even zero) characters, and the symbol _ matches a single character only.
· Configuration: there are two kinds of templates. For the first one, the chart is created right after the specification of the basic data, in which case this step is omitted. For the second kind, the system shows the measurements found and the names of the charts to be created, from which any can be deselected before pressing the “OK” button, and thus before creating the chart.
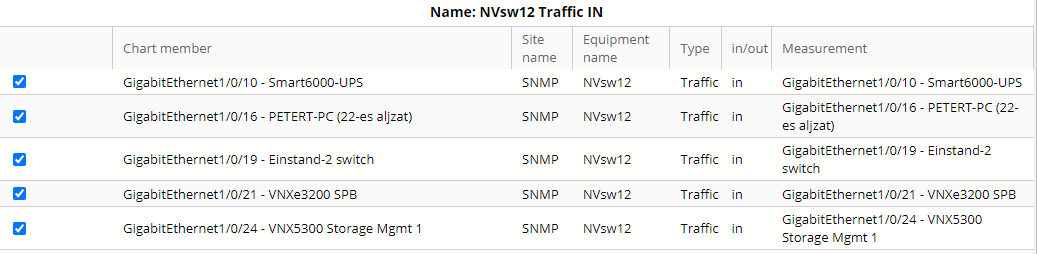
Figure 36. Template based chart creation
The template based creation of several charts is very similar to this instance where we get the above table in several copies:
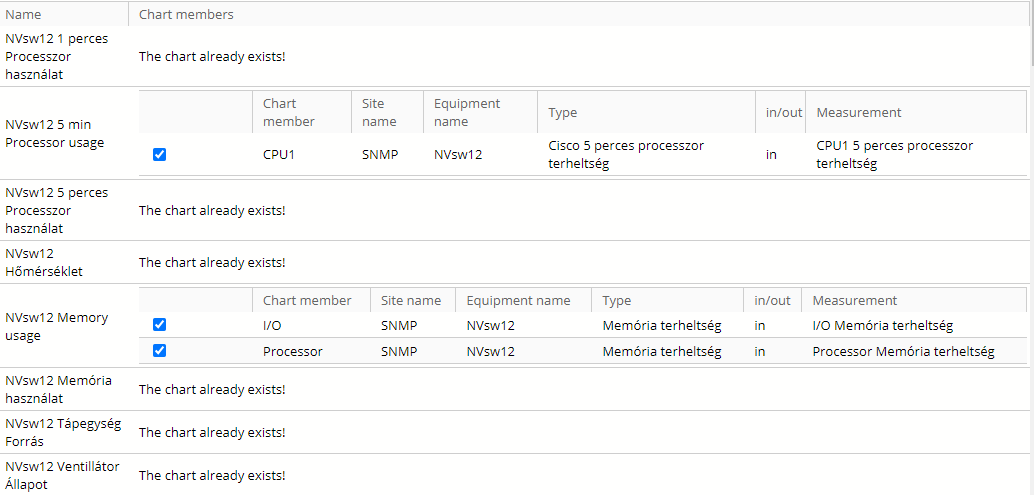
Figure 37. Template based multiple chart creation
6.2.6.4 View
By navigating the site-equipment hierarchy starting from the “Measurements” menu item, all private and those public charts can be accessed for which the user has access rights.