| Previous | 14.1 Specifics of measurement server types | Next |
|---|
14.1.2 SNMP measurement servers
PVSR offers several collector specific pages to aid the operators during their troubleshooting and diagnostic processes. For SNMP equipments and for equipments for which PVSR is using the SNMP protocol (IPSec, Cisco SAA, Cisco QoS and Cisco PING) the following pages are available. Please note that some of the pages are not available for every equipment, for example the Cisco CDP data page is only available for Cisco devices.
The following pages are available:
· 14.1.2.4 IP addresses and routing
· 14.1.2.5 TPC and UDP connections
· 14.1.2.6 Interface information, Interface traffic and Ports
· 14.1.2.7 MAC addresses seen on the ports
· 14.1.2.11 ASA Remote Sessions
14.1.2.1 Processes
The page shows the processes on a given equipment using the HOST-RESOURCES MIB. The page is refreshed automatically. If the monitored equipment is a Windows then PVSR will only refresh the page every two minutes, because Windows only updates the content of the corresponding SNMP table only every two minutes. The CPU column is only showed after the first page refresh.

Figure 127. SNMP collector page: Processes
14.1.2.2 Disks
The page shows the disks in a given equipment using the HOST-RESOURCES MIB.
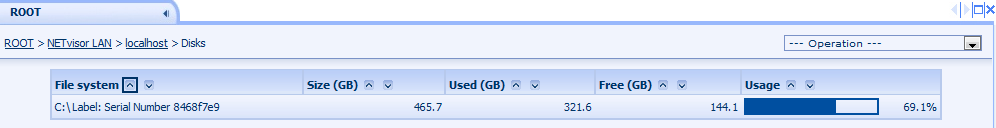
Figure 128. SNMP collector page: Disks
14.1.2.3 Custom SNMP query
The page can be used to query any SNMP value from the equipment. For security reasons only administrators can access this page. The query variable can be any OID or it can also be an item from one of the uploaded SNMP MIBs. By default PVSR resolves the received OID, showing the name of the item from a MIB file, unless the “Result OIDs in numerical format” checkbox is checked, in which case the OID is shown in the numerical format (1.3.6.1…). Only by default PVSR will try to show a string value as a readable string (if it only contains printable characters), unless the “Only hexa octet strings” option is checked, in which case it will always show the strings in hexadecimal format.
PVSR can show the result in two different ways. Either as an SNMP table, in which case each row represents one instance and the columns represent the variables in that table, or as a simple table, where each row represents one particular OID. If the OID to be queried is coming from a MIB file and its name ends with either Table or Entry then by default PVSR will automatically assume that it represents an SNMP table and act accordingly. The first screenshot shows the SNMP table representation and the second one the simple representation.
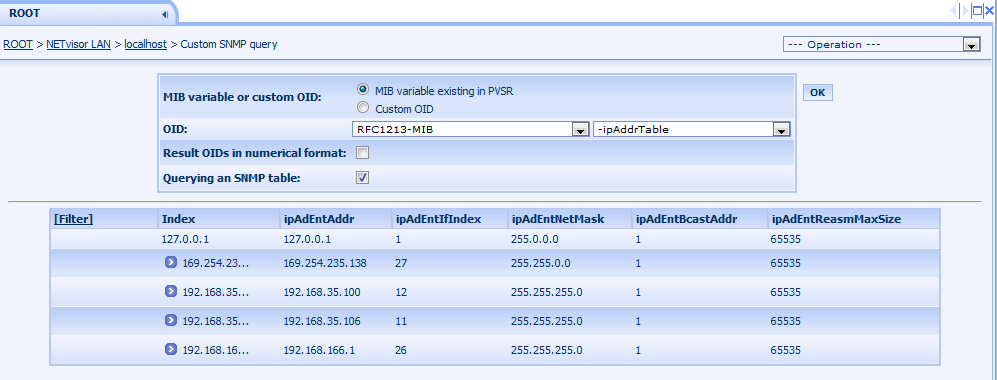
Figure 129. SNMP collector page: Custom SNMP query I.

Figure 130. SNMP collector page: Custom SNMP query II.
14.1.2.4 IP addresses and routing
The page shows three separate tables. The first contains the IP addresses of the equipment, and for each address it shows the interface on which it is present and the network mask. The second table shows the IP routing table of the device, with the interface, network mask, the type of the routing entry and also the gateway (next hop) address. The third table shows the ARP – address resolution protocol – table, i.e. an IP address – MAC address correlation table.

Figure 131. SNMP collector page: IP addresses and routing
14.1.2.5 TPC and UDP connections
The page shows the listening TCP and UDP ports on an equipment as well the established TCP connections. For an established connection it also shows the remote IP address and port as well, not just the local address and port. The page is refreshed by default every minute.
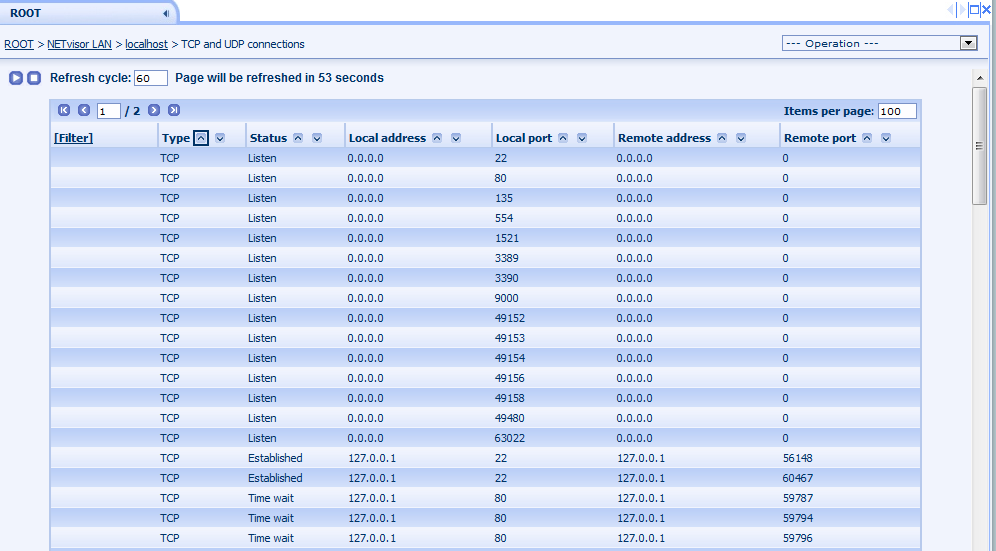
Figure 132. SNMP collector page: TCP and UDP connections
14.1.2.6 Interface information, Interface traffic and Ports
These pages show interface related information. The main difference between them is the way they present the information:
· The Interface information gives detailed information about the interfaces but only shows the interface traffic as bar chart
· The Interface traffic contains only a limited number of interface information but it shows beside the traffic several packet bar charts
· The Ports only shows those interfaces which are present in the physical entity MIB, but it shows them in a hierarchical way based on the entity MIB and colors them according to their statuses and error counters
In all three cases: it does not matter whether the interface exists as a measurement or not, it is shown either way.
All of these pages are refreshed periodically. When either of them is selected from the Operations then PVSR does an extensive SNMP discovery to query several static information (like the name of an interface) and also waits 10 seconds to query the counter parameters once more so that it is able to show traffic information. When the page is refreshed or when the user uses the links on the top of the page to switch between these views then PVSR only refreshes the counter and status parameters and uses the counter values from the previous refresh to show the traffic information. However: if the uses choses a view from the Operation drop-down list then this constitutes a new “session”, i.e. PVSR will do the extensive SNMP discovery once more and the traffic data will only represent the time span when the page was generated on the server.
Interface information
The table shown on the page contains many interface parameters, some of them are in separate columns, some of them are only displayed when the detailed information for the last column called Other is shown.

Figure 133. SNMP collector page: Interface information
The parameters are:
· Index: index of the interface
· Name: based on the ifName parameter. If the interface has an alias then it is also shown if the mouse cursor is placed above the name
· Type: if the interface is present in the physical entity SNMP table and its type from that table is known by PVSR (i.e. the appropriate MIB had been uploaded) then the type name from that MIB, otherwise the type from the standard interface table
· Speed: interface speed. If the interface percentage traffic measurement for the interface exists in PVSR then it takes the interface speed from that measurement, otherwise it takes the speed from the standard interface SNMP table
· Admin and Oper: the administrational and operational status of the interface
· Traffic: current the input and output traffic on the interface. It can be shown in percentage as well, in which case PVSR compares the current traffic to the interface speed. If the interface percentage traffic measurement for the interface exists in PVSR then it takes the interface speed from that measurement, otherwise it takes the speed from the standard interface SNMP table
· Error (In/Out): the number of input and output packet errors / second
· Other: additional parameters. They are only present when they are not empty
o Description: the value of the ifDescr SNMP variable
o Name: the same as the separate column
o Alias: the value of the ifAlias SNMP variable
o IP addresses: IP addresses on the interface
o Errors, Unicast, Non-unicast, Multicast and Broadcast packets: the number of packets / second
o Spanning status
o Interface speed: the speed from the standard table. It is only shown if PVSR fills in the Speed column using the percentage traffic measurement from its database
o Desired speed: only present for Cisco equipments
o Duplex: only present for Cisco equipments
o Entity description: only present if the interface is present in the physical entity SNMP table
o Entity parent: only present if the interface is present in the physical entity SNMP table
Interface traffic
The page only shows less column, but the traffic, unicast and non-unicast packet parameters are shown as bar charts. The non-unicast is only divided into multicast and broadcast if at least one interface supports the SNMP counter needed for this type of information and the Detailed view checkbox is checked.

Figure 134. SNMP collector page: Interface traffic
Ports
This view only shows those interface which exist in the physical entity MIB. For each port only the name, traffic and error (packets / second) is shown, and a color coding:
· Orange: the administrational status is up but the operational is not
· Red: there are interface errors
· Green: OK

Figure 135. SNMP collector page: Ports
Detailed interface page
From each view the same detailed interface page can be accessed: in case of the Interface information and Interface traffic page click on the [Details] link, or on the name of the interface on the Ports page. The detailed interface page contains every interface parameter and also three charts:
· Traffic
· Interface error
· Packets
To empty the charts click on the [Empty charts] link.
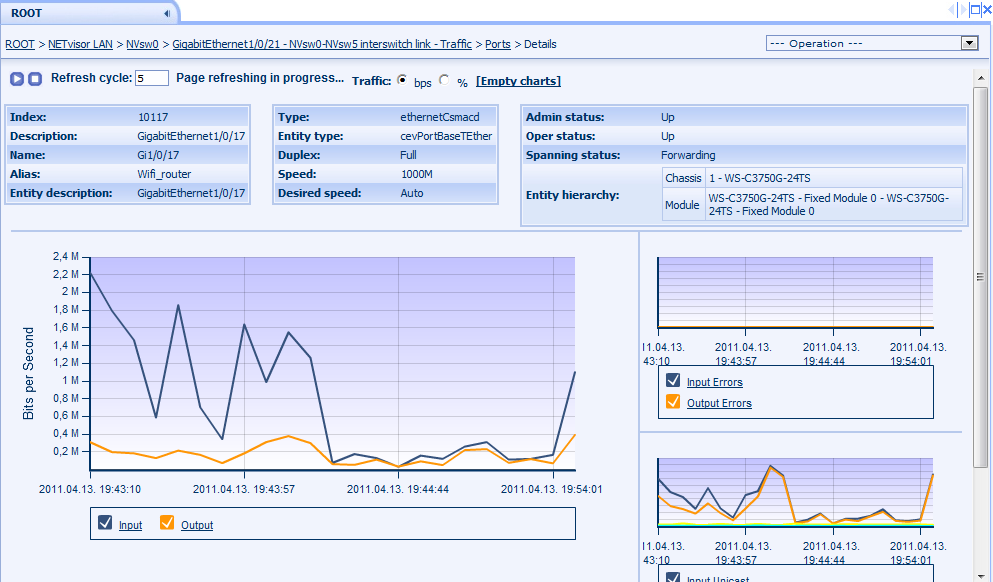
Figure 136. SNMP collector page: Interface detailed information
14.1.2.7 MAC addresses seen on the ports
The page shows all the MAC addresses the equipment saw and also the interface on which it had been detected. Two additional columns are shown in case of Cisco equipments: the id and the name of the VLAN.
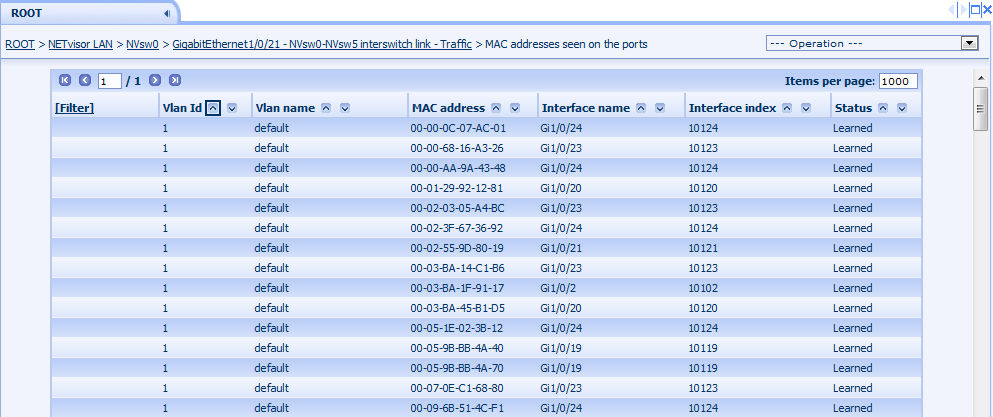
Figure 137. SNMP collector page: MAC addresses seen on the ports
14.1.2.8 Cisco CDP data
The page is only shown for Cisco equipments. It displays basic CDP parameters (for example whether it is turned on or not), and if the CDP is enabled for the equipment then it also shows all its neighbors:
· Local interface: the interface on the equipment where the neighbor was seen
· Spanning status: spanning status of the local interface
· Device Id: the Id of the remote equipment
· IP address: the IP address of the remote equipment
· Device type: the type of the remote equipment
· Remote interface: the interface on the remote equipment connected to the local interface
· Device description: the system description of the remote equipment

Figure 138. SNMP collector page: Cisco CDP data
14.1.2.9 Cisco VLANs
The page is only shown for Cisco equipments. It displays every VLAN on the equipment, the MTU (Maximum Transmission Unit) for that VLAN, its status, type and the number of interfaces belonging to that VLAN. This last field has also a detailed view where all the interfaces are shown.
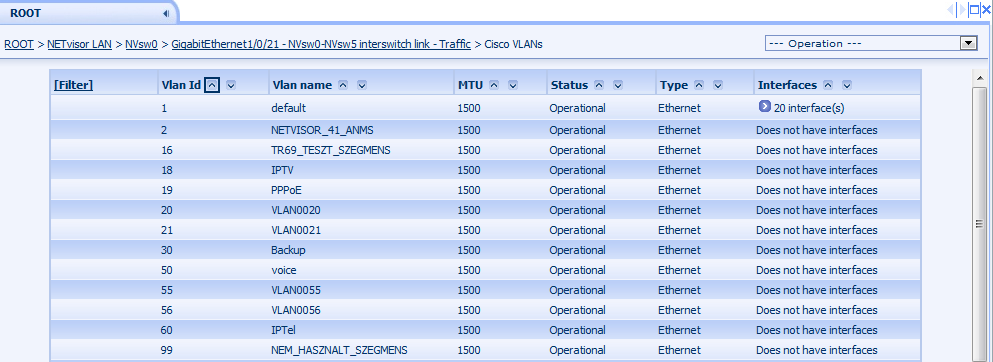
Figure 139. SNMP collector page: Cisco VLANs
14.1.2.10 ASA IPSec Tunnels
This page is only available if the equipment has IPSec related measurements. It is automatically refreshed and it shows the IPSec tunnels currently present on the device. For each tunnel it shows the remote IP address, whether the IKE tunnel is still alive or not, when was the tunnel activated, both the normal and uncompressed input and output traffic since the last page refresh, the cumulative number of fails for the tunnel (this can be expanded for further details) and the input and output packets per second (this can be expanded for further details).
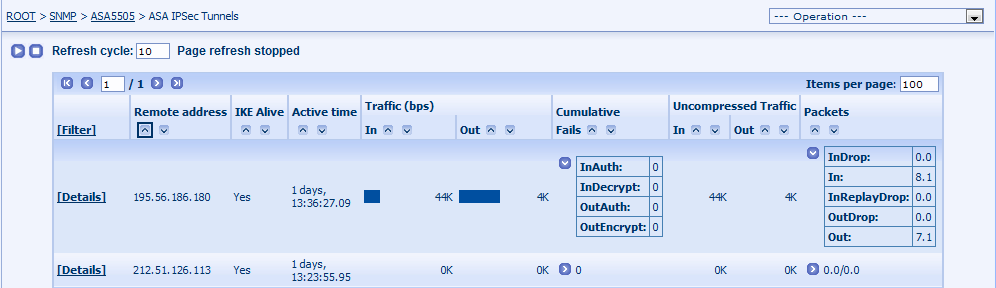
Figure 140. SNMP collector page: ASA IPSec Tunnels
The Details link shows the same information for the selected tunnels, except that it shows the traffic counters on charts:

Figure 141. SNMP collector page: ASA IPSec Tunnel details
14.1.2.11 ASA Remote Sessions
This page is only available if the equipment has IPSec related measurements. It is automatically refreshed and it shows the remote sessions currently present on the device. For each session it shows the user name, the group of the user, the IP address the assigned to the user after login, its original IP address, the version of the client used to establish the connection, when did the user log in and the input and output traffic both in bits per second and packets per second:
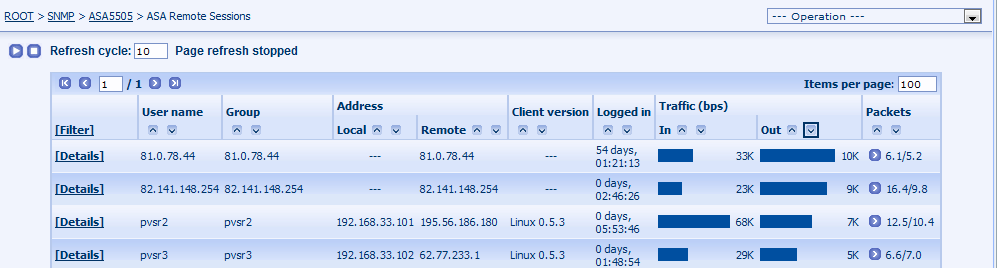
Figure 142. SNMP collector page: ASA Remote Sessions
The Details link shows the same information for the selected session, except that it shows the traffic counters on charts:
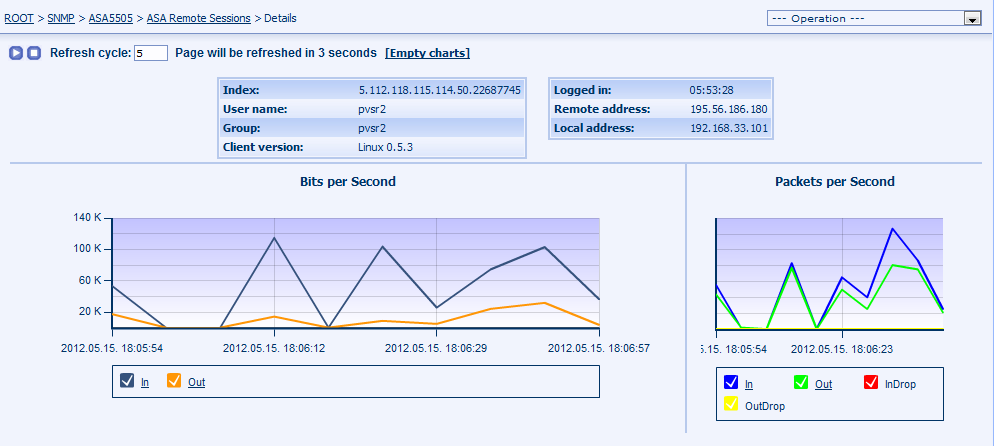
Figure 143. SNMP collector page: ASA Remote Session details
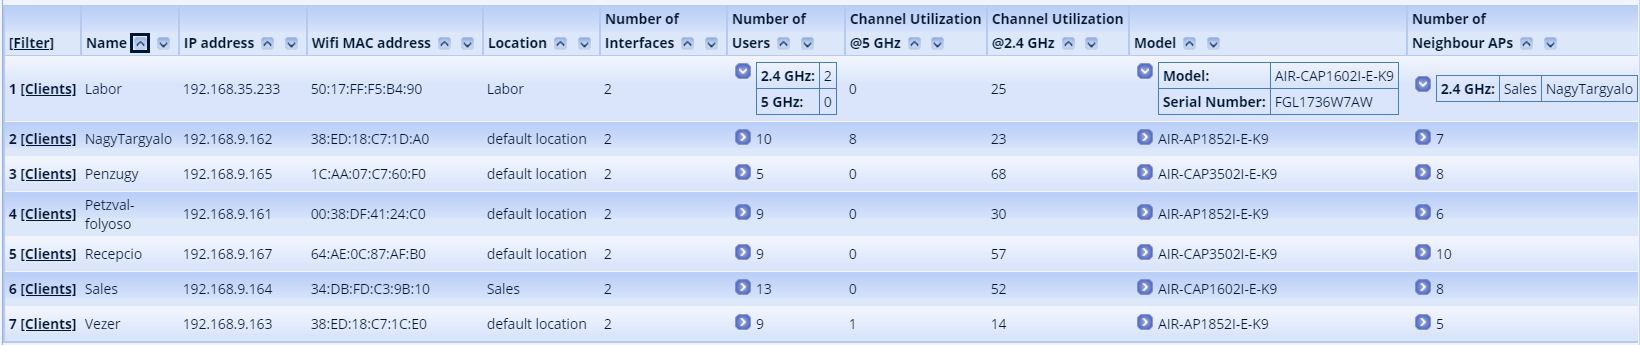
14.1.2.12 WLC Access Points
The page is onlyí available for Cisco WLC devices. The page shows the access points managed by the device, the clients served by the access point on the different channel frequencies, model/IP/MAC information and it also shows the other neighboring access points.
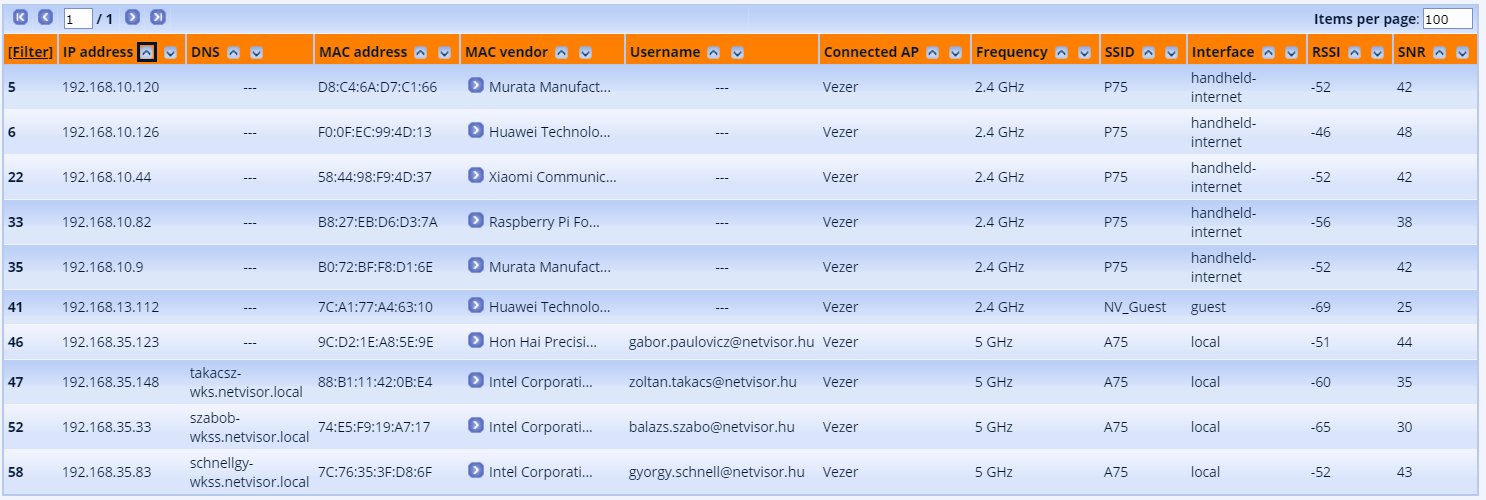
14.1.2.13 WLC Clients
The page is only available for Cisco WLC devices. The page shows the different clients connected to any of the access point managed by the device, their IP address, DNS name and user name (if available), the AP and network it is connected to and the measured radio parameters (RSSI and SNR)
14.1.2.14 FortiGate Tunnels
The page is only available for FortiGate firewalls. It shows the local and remote IP addresses for a tunnel, along with the user’s name, the name of the virtual domain in the firewall, the time when the connection was established and the current input and output traffic in the tunnel.