| Previous | 14.1 Specifics of measurement server types | Next |
|---|
14.1.4 Oracle measurement servers
The Oracle measurement server is an active and discoverable PVSR module used for the monitoring of Oracle 8, Oracle 9i and Oracle 10g servers. The measurement server does not take into account the timeout and retry values specified at the equipment. Beside the basic ones, the equipments have the following attributes (the code of the parameter is given in parenthesis; see Subsection 7.5.6 on Parameters of non-SNMP data collectors):
- Connection identifier (ORA EQ 1
- TNS entry: The entry of the tnsnames.ora file used by Oracle (located in: ORACLE_HOME/network/admin), e.g.: eles.rendszer.vallalat.hu or simply eles.
- Separate identifier: An identifier description in the format used in the TNS file, for example:
(DESCRIPTION =
(ADDRESS_LIST =
(ADDRESS = (PROTOCOL = TCP)(HOST = electra)(PORT = 1521))
)
(CONNECT_DATA =
(SERVICE_NAME = pvsr.electra)
)
)
In general this format is recommended, since the success of the measurement does not depend on the entries defined in the tnsnames.ora file. It is important to note that, contrary to format used in the file, here comment lines (with the # character) cannot be used.
- User (ORA EQ 2 USER): Single line field, which can be seen by non-administrators as well. The field contains the user name of the database connection, it must be specified. The user must have read access to several SYS tables, therefore it is recommended to use a user with the “SELECT ANY TABLE” privilege or with the “SELECT_CATALOG_ROLE” role
- Password (ORA EQ 3 PASSWORD): Single line field, which cannot be seen by non-administrators. The field contains the password of the user of the database connection. It is mandatory.
- Privileges (ORA EQ 4 SYS): A dropdown field, which cannot be seen by non-administrators. The field contains the level of privileges of the database connection (in increasing order:
- Oracle version (Z 01 VERSION): The version of the database. Non-modifiable automatically discovered parameter
- Instance host(s) (Z 02 HOST_NAMES): The hosts on which the database is running. Non-modifiable automatically discovered parameter
- Archive mode (Z 03 LOG_MODE): The archive log mode of the database. Non-modifiable automatically discovered parameter
For Oracle measurement servers a given set of variables can be used to define measurements. Accordingly, the system contains several measurement definitions by default, but naturally these can be changed freely. The default measurement definitions are the following. The descriptions of the individual Oracle performance variables can be found in Oracle Administrator Reference manual or in the STATSPACK documents.
- Active sessions
- Logons
- Block changes/ second
- Block changes /transaction
- Buffer hits
- User calls / second
- User calls / transaction
- Physical writes / second
- Physical writes / transaction
- Physical reads / second
- Physical reads / transaction
- Hard parse / second
- Hard parse / transaction
- Tablespace used space (blocks)
- Tablespace used space (MByte)
- Commit/ second
- Tablespace utilization
- Library hits
- Log switches
- Logical reads / second
- Logical reads / transaction
- Tablespace total size (block)
- Tablespace total size (MByte)
- Total session
- Parse / second
- Parse / transaction
- Redo size / second
- Redo size / transaction
- Sorts / second
- Sorts / transaction
- Tablespace free space (block)
- Tablespace free space (MByte)
- Transactions / second
- Waits: CPU
- Waits: Direct write
- Waits: Direct read
- Waits: Indexed read
- Waits: Log synch
- Waits: Total
- Waits: Parallel write
- Waits: Parallel read
- Waits: Full table/index read
- Wait classes
- Executions / second
- Executions / transaction
- Rollbacks / second
- Number of sessions and processes (current, max and limit)
- Uptime
The Oracle data collector server also contains a nondiscoverable measurement: the user can create his own arbitrary select command that returns a number value only, and the PVSR processes this value as a measurement value.
The Oracle measurement server does not provide UPTIME data.
The measurement server also creates a “Default Oracle” equipment template at installation time, which can be used to insert the tablespace utilization, MB size, user active and total sessions, and all active and total sessions variables along with the major performance indicators and wait statistics. Furthermore, several chart templates are created as well:
- Oracle active sessions: the active sessions of users drawn with superposed bars
- Oracle total sessions: all sessions of users drawn with superposed bars
- Oracle tablespace used MByte: the used size of tablespaces drawn with superposed bars
- Oracle tablespace usage: the tablespace utilizations drawn with superposed bars
- Oracle tablespace space usage: the total and used size for one tablespace
- Oracle waits: collects the individual concrete waits measurements augmented with a line showing the total waits
- Oracle wait classes: displays every wait class on one chart
PVSR offers several collector specific pages to aid the operators during their troubleshooting and diagnostic processes. For Oracle equipments the following pages are available.
· 14.1.4.3 Tablespaces and Data files
14.1.4.1 Sessions
The page is automatically refreshed. When it is selected from Operations then it waits a couple of seconds before returning so that it can show wait statistics. Later on it will display statistics since the last refresh. The page shows three tables: basic equipment parameters, wait classes and sessions. The basic equipment parameters are the following:
· Started at: when was the database started
· Sysdate: the current date on the server running the Oracle database
· Timespan: the wait statistics are shown for the last this many seconds
· Logons and logoffs: how many session was created and terminated during the timespan
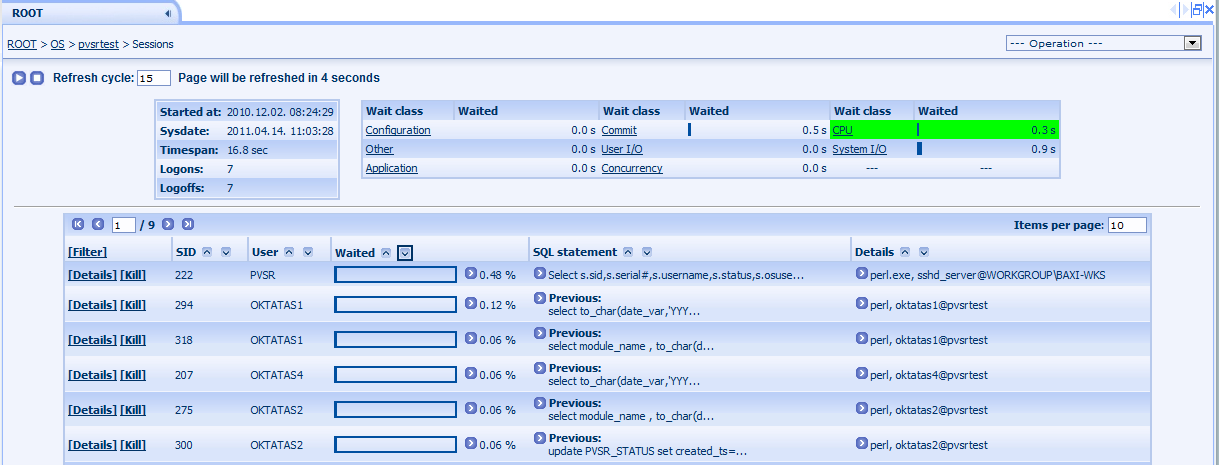
Figure 144. Oracle collector page: Sessions with only the CPU wait class selected
The wait classes are only shown for Oracle 10 and above. For each class the number of seconds spent waiting in that class is displayed. If the user clicks on a wait class name then PVSR will only show the waits from that class in the session table below. Clicking on the name again disables this filtering.
The third table contains the sessions with the following parameters:
· SID: the session identifier
· User: the name of the Oracle user
· Waited: how many percentage of the time the session has been waiting. The detailed information in this cell shows the exact wait events and their percentage
· SQL statement: if the session has a currently executed SQL statement then that statement, if not then the previous statement
· Details: it contains the OS user, client machine and program name. The detailed view in this cell also shows the status, client and server program ID (PID), when was the session established and when was the last call sent to the server
With the exception of the basic system sessions (log writer, checkpoint, …) each session has a [Kill] link in its row which can be used to kill the session.
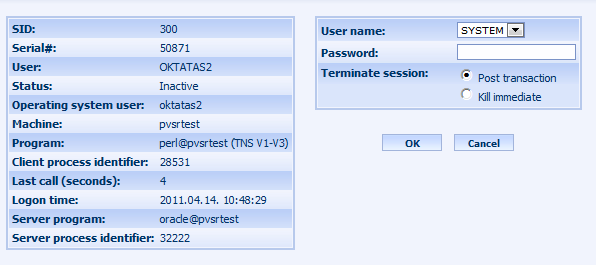
Figure 145. Oracle collector page: Kill session
The kill session page shows the session parameters and a table containing the kill parameters:
· User name and Password: the name and password of the user to be used to kill the session. If PVSR is monitoring the Oracle with SYS or SYSTEM and the PVSR WEB user has administrator rights then the system automatically uses that user and these fields are not shown
· Terminate session: how to kill the session: wait for its current transaction to commit or rollback, or kill it immediatelly
Every session also has a [Details] link which shows the main session parameters, a link to kill the session, the current and previous SQL statement along with its execution plan and execution statistics (details in the Other column) and a chart showing the top wait events for this session. To empty the chart click on the [Empty chart] link.
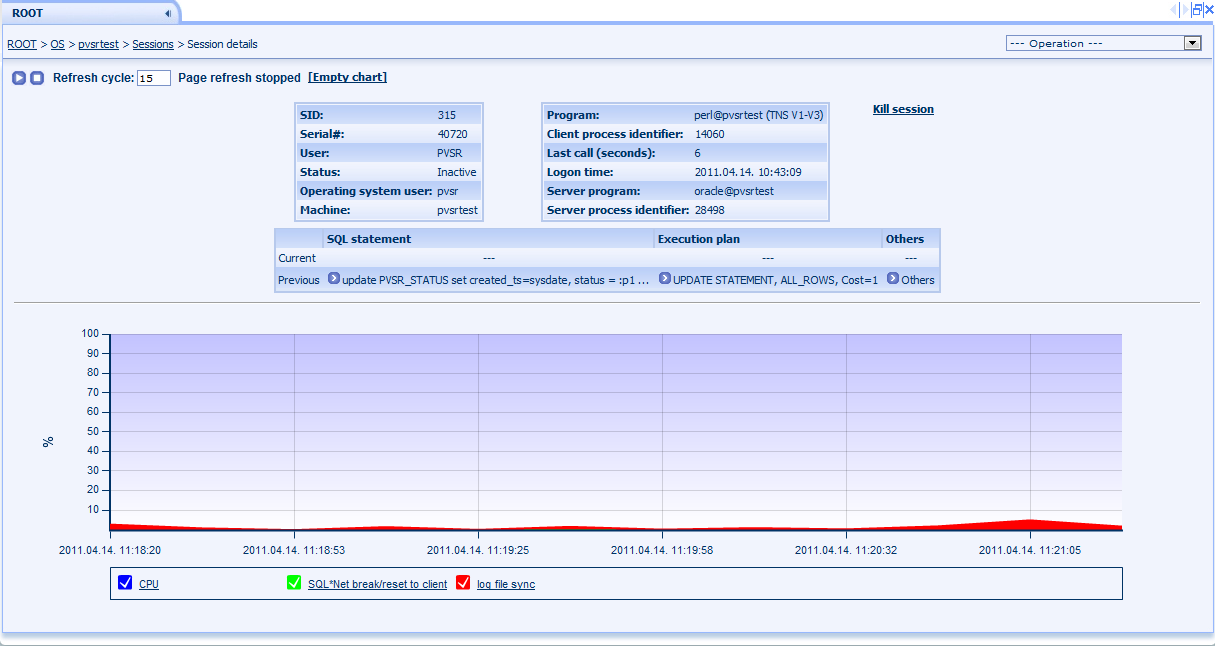
Figure 146. Oracle collector page: Session details
14.1.4.2 Blocking sessions
The page contains only one table which shows the Oracle sessions blocking each other.
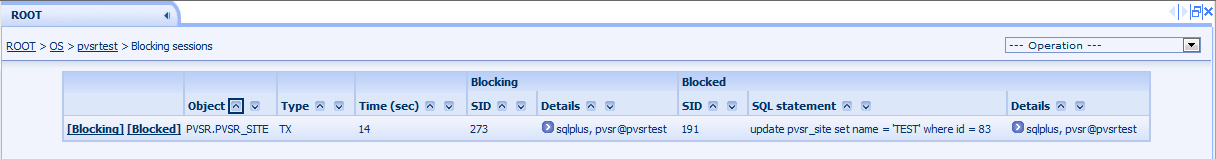
Figure 147. Oracle collector page: Session details
The parameters in the table are:
· Object: the name of the object both sessions want to have access to
· Type: type of the lock. The most common lock is TX, which means that the two sessions want to change the same row in the table. All the other locks are documented in the corresponding Oracle documentation.
· Time: how many seconds have passed since the locking occurred
· Blocking SID and Details: the same columns as on the Sessions page for the blocking session
· Blocked SID, SQL statement and Details: the same columns as on the Sessions page for the blocked session
The links [Blocking] and [Blocked] takes the user to the Session details page for the selected session.
14.1.4.3 Tablespaces and Data files
The Tablespace and the Data files pages are similar in the sense that they both show the same information – space usage in the Oracle database – but different in the way they do it.
The Tablespaces page shows every tablespace and they usage:

Figure 148. Oracle collector page: Tablespaces
The [Details] link shows more detailed information about the tablespace, including its status, type, block size, the allocation type for the segments in it, whether the logging is enabled or not and all its data files. The data files have an additional size parameter called “Extend until” which is empty if the autoextension is not enabled for the file.

Figure 149. Oracle collector page: Tablespace details
The Data files page shows mainly the same parameters for each data file as the tablespace details page, with the addition of the tablespace name. If the user clicks on the name of the tablespace then he sees the same details page as can be seen above.
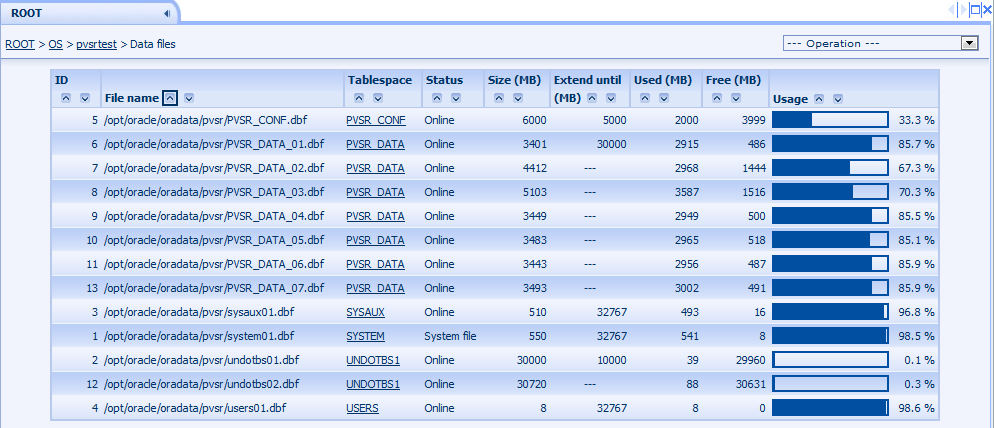
Figure 150. Oracle collector page: Data files
14.1.4.4 Redo logs
The page shows two tables: the first contains the current redo logs, with their sizes, statuses, whether they have been already archived or not and their sequence number. The second table shows the history for the redo log changes: the times between the redo log contains the changes and also the duration of this timespan in seconds.

Figure 151. Oracle collector page: Redo logs
14.1.4.5 Archive settings
The page shows two or three tables. The first contains basic archive settings and the second the configured archiving destinations. The third is only shown if the flash recovery area is enabled in the database: in this case it shows its usage by the different data types.

Figure 152. Oracle collector page: Archive settings
14.1.4.6 Backups
The page shows the RMAN backups:
· Backup name: auto generated by Oracle or specified in the RMAN command
· Started at: when was the backup started
· Time taken: its format is HH:MM:SS
· Status: for example Completed, Running, Completed with errors, …
· Type: for example Database full, Control file, Archive log, …
· Output type: Disk or Tape
· Input and Output size
· Output rate: speed of writing
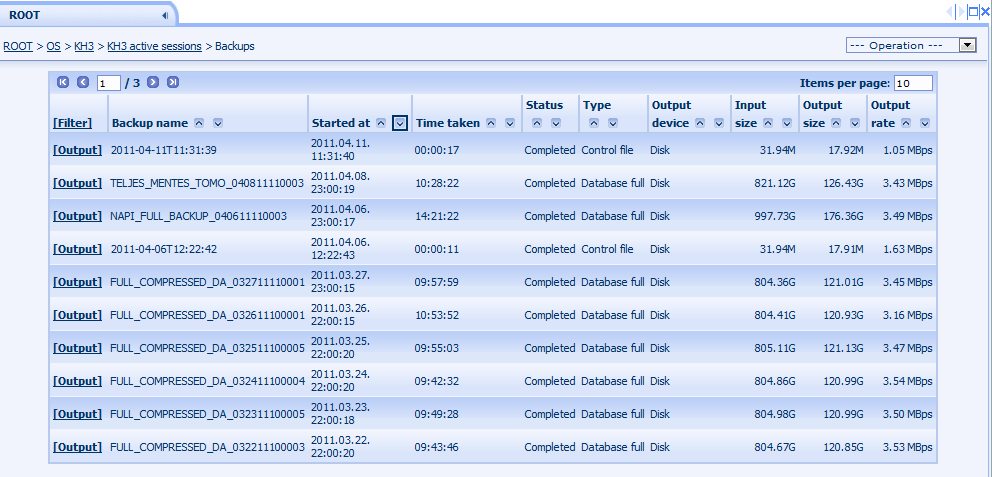
Figure 153. Oracle collector page: Backups
The [Output] link shows the text output of the RMAN command:

Figure 154. Oracle collector page: RMAN output
14.1.4.7 Users
The page shows the Oracle users:
· Name: name of the user
· Status: is the user locked or has his password been expired
· Default tablespace: where his new schema objects are created unless specified otherwise
· Temporary tablespace: his tablespace used for sorting and temporary segments
· Created: when was the user created
· Schema size: the total space usage of the objects in the schema of the user
· Lock date: it is empty if the user is not locked
· Expire date: when will the password expire or when expired the password
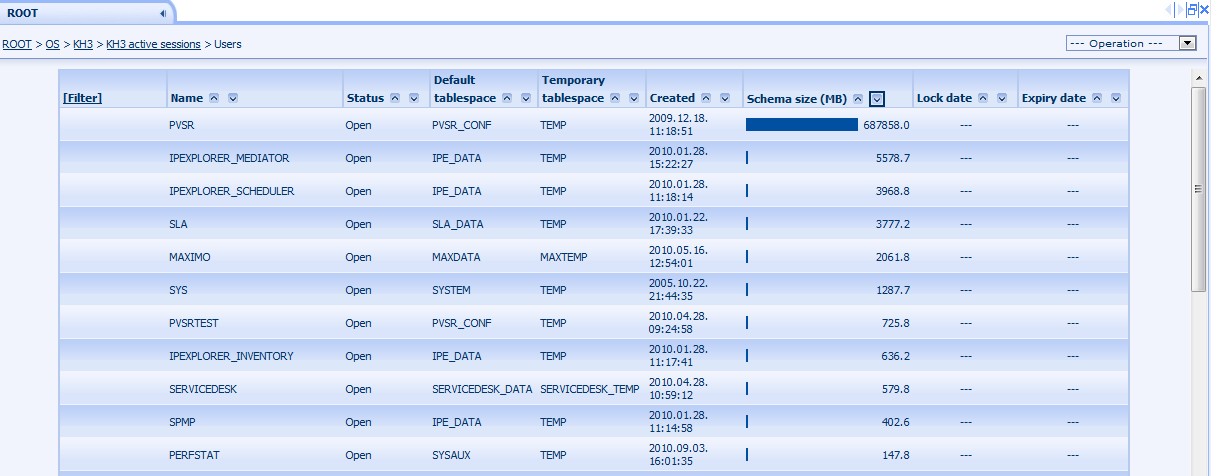
Figure 155. Oracle collector page: Users
14.1.4.8 Segments
The table shows every segment in the database with the following information:
· Owner and Name: this identifies the object
· Type: for example: Table, Index, Lob segment, …
· Tablespace: where the data can be found. If the object is partitioned and its partitions are in different tablespaces then the object will appear in more than just one row
· Size in MB
· Partitions: the number of partitions belonging to this object in this tablespace. If there are no partitions in the database then this column is not shown
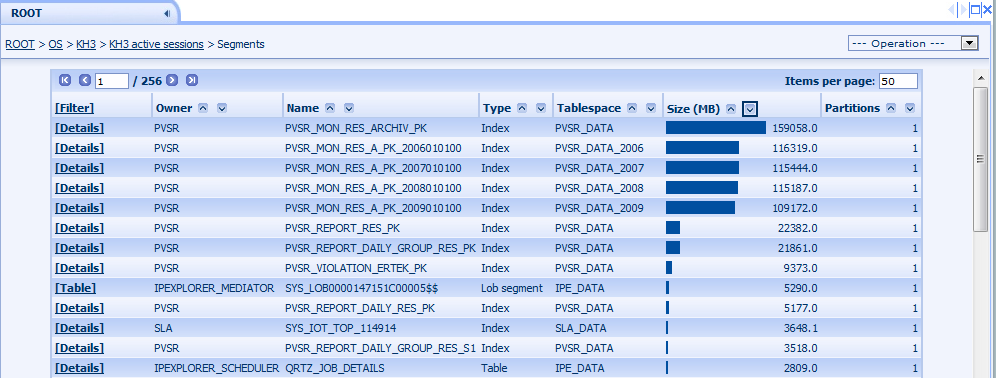
Figure 156. Oracle collector page: Segments
The table and index objects have a link called [Details] in their rows: it shows detailed information about the table or index. The lob segments have a [Table] link: it shows detailed information about the tables they belong to.
The table details page shows basic table parameters, the columns in the table, its indexes and all of its extents. The basic parameters are the following:
· Owner and Name: the same as above
· Partitioned: Yes or No
· Cache: whether the Oracle wants to keep the segment in the KEEP cache
· IOT: is the table an Index-Organized-Table or not
· Last analyzed: when was the last statistic gathering
· Average row length: the average size of a row in the table in bytes, based on the statistics gathering
· Number of rows: based on the statistics gathering, not the real value
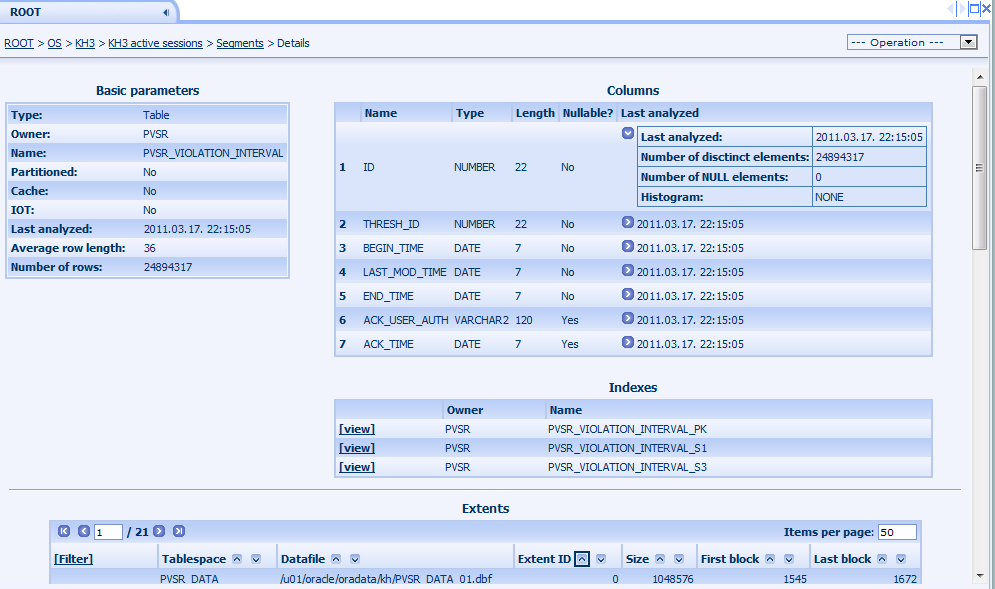
Figure 157. Oracle collector page: Table details
For each column the table shows its name, type, whether it can be null or not and also its statistics. Each row in the indexes table has a [view] link which shows the detailed information for that index. This is the same page as the one accessible for an index from the Segments page:

Figure 158. Oracle collector page: Index details
The index details page shows similar basic information as the table details page, but it also has a new row indicating the table to which the index belongs and the [view] link in this row can be used to navigate to the table details page. The columns table is also different, because it only shows the name of the column and whether the ascending or the descending ordering is used in the index.
14.1.4.9 Every wait event
The table shows for every Oracle wait event type the number of seconds waited since the database started and also the number of seconds waited since the last page refresh. If the user clicks on the [Monitoring] link in a row then PVSR shows two charts with these values for the selected wait event.
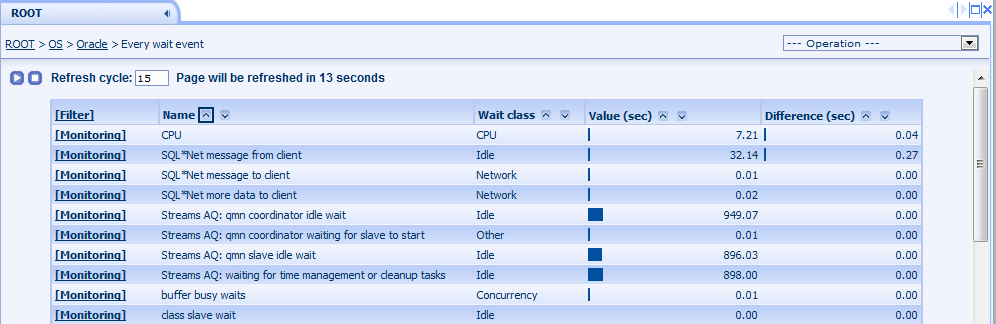
Figure 159. Oracle collector page: Every wait event
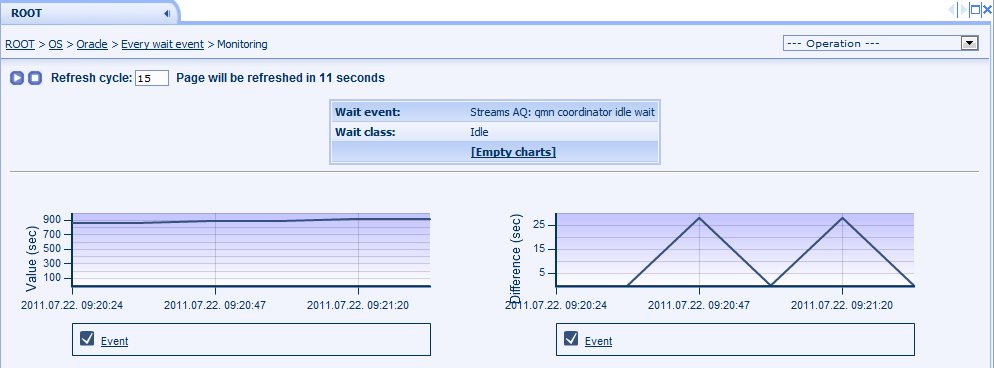
Figure 160. Oracle collector page: Wait event details
14.1.4.10 Every statistic
The table shows for every Oracle statistic their current values and also the value change since the last page refresh. If the user clicks on the [Monitoring] link in a row then PVSR shows three charts with these values for the selected statistic and also the difference divided by the number of seconds passed since the last page refresh.

Figure 161. Oracle collector page: Every statistic
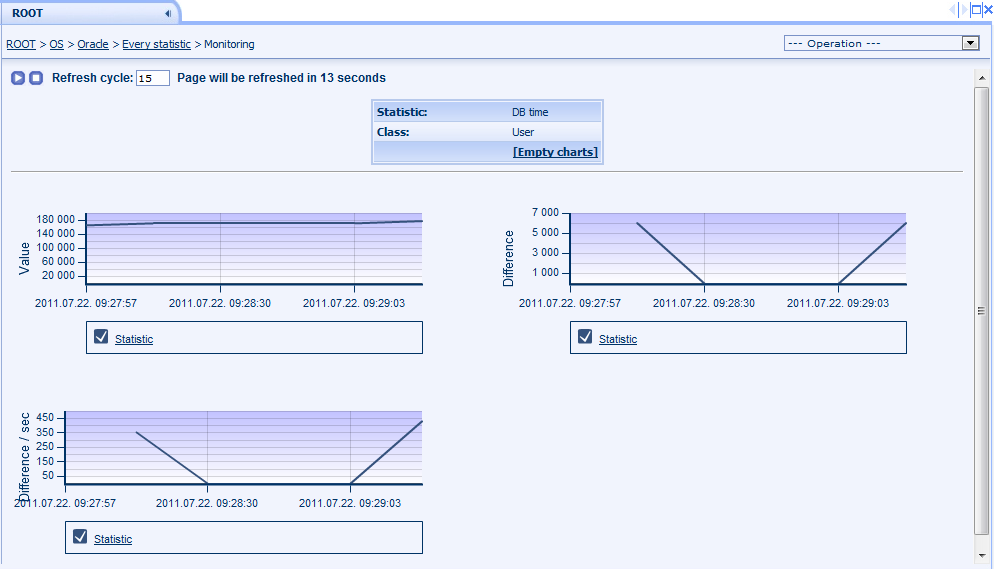
Figure 162. Oracle collector page: Statistic details
14.1.4.11 Every parameter
The page shows every Oracle server parameter along with their description, value and whether their value is set to the default value or not.
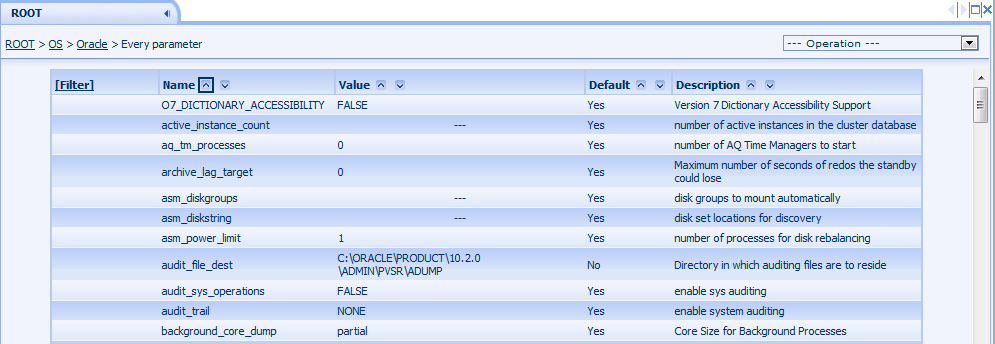
Figure 163. Oracle collector page: Every parameter
14.1.4.12 Custom select
This page is available only to administrator users. The user can specify any select statement and the page shows its result in a table:
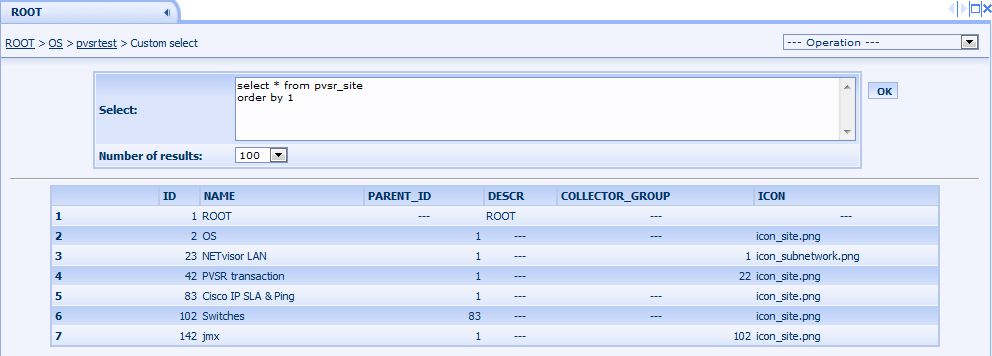
Figure 164. Oracle collector page: Custom select