| Previous | 14.1 Specifics of measurement server types | Next |
|---|
14.1.5 MySQL measurement servers
The MySQL measurement server is an active and discoverable PVSR module used for the monitoring of MySQL database servers. The measurement server does not take into account the retry value specified at the equipment, only the timeout. Beside the basic ones, the equipments have the following attributes (the code of the parameter is given in parenthesis; see Subsection 7.5.6 on Parameters of non-SNMP data collectors):
· Host (MYSQL EQ 1 HOST): the host where the MySQL database is running. Mandatory parameter
· User (MYSQL EQ 2 USER): the user name used for the connection. Mandatory parameter. The user must have at least the following rights for the database monitoring, but if you want to use the databases and the tables collector pages as well then the SELECT grant is also needed for those databases. The minimum rights:
GRANT show databases ON *.* TO <pvsr_monitoring_user>;
GRANT process ON *.* TO < pvsr_monitoring_user >;
GRANT select ON mysql.user TO < pvsr_monitoring_user >;
· Password (MYSQL EQ 3 PASSWORD): the password used for the connection. Mandatory parameter
· Database (MYSQL EQ 4 DATABASE): the name of the database to be selected after the PVSR connected to the MySQL server. The parameter is optional, if not specified then PVSR will use the user’s default database
· MySQL version (Z 01 VERSION): the database version. Non-modifiable automatically discovered parameter
· Compiled for (Z 02 COMPILED_FOR): the type of the OS on which the database is running. Non-modifiable automatically discovered parameter
PVSR contains several predefined measurements for the MySQL database:
· Active connection
· All connection
· Commits
· Custom query (diff)
· Custom query (diff/sec)
· Custom query (value)
· Database index size
· Database table size
· Database traffic
· Delete calls
· Deleted rows
· Full scan row read
· Index row read
· InnoDB buffer free
· InnoDB buffer hit
· InnoDB buffer modified
· InnoDB buffer size
· InnoDB data file operations
· InnoDB data file usage
· InnoDB dictionary
· InnoDB rows deleted
· InnoDB rows inserted
· InnoDB rows read
· InnoDB rows updated
· InnoDB semaphore OS waits
· InnoDB semaphore spin rounds
· InnoDB semaphore spin waits
· InnoDB undo history length
· Insert calls
· Inserted rows
· Key cache hit
· Merge sort
· Opened table definitions
· Opened tables
· Procedure calls
· Query cache free
· Query cache hit
· Query cache items
· Query cache size
· Range sort
· Replace calls
· Rollbacks
· Scan sort
· Select calls
· Table lock immediate
· Table lock waited
· Temporary table creation in memory
· Temporary table creation on disk
· Update calls
· Updated rows
It also contains three non-discoverable measurements: Custom query (value), Custom query (diff) and Custom query (diff/sec). For each of them the user has to specify a select statement. The statement has to give back one row and only one column in that row. PVSR will display the result of that statement either as a value, as a difference between the current and the previous value or it can also divide the difference with the collection cycle.
PVSR also has a default MySQL equipment template which creates all the discoverable measurements and also offers several threshold templates by default.
PVSR offers several collector specific pages to aid the operators during their troubleshooting and diagnostic processes. For MySQL equipments the following pages are available:
· 14.1.5.4 Every status variable
· 14.1.5.5 Every server variable
14.1.5.1 Connections
The page is automatically refreshed. When it is selected from Operations then it waits a couple of seconds before returning so that it can show wait statistics. Later on it will display statistics since the last refresh. The page shows three tables: basic database parameters, important database KPIs and sessions.

Figure 165. MySQL collector page: Connections
The basic equipment parameters are the following:
· Version: the version of the server
· Storage engine: the storage engine of the server
· Up sine: the uptime of the server
· Logons: the number of logons since the last page refresh
· Logoffs: the number of logoffs since the last page refresh
The KPI table shows the InnoDB, query and key cache hits during the last refresh cycle and also the number of different statement (select, insert, update, replace, delete and procedure call) per second for the same time period.
The session table shows for each connection its ID, the name of the connected user, the host from where it is connected, the selected database, the command type of the statement the connection is currently running, its state, the number of seconds it has spent in the current state and the currently running statement.
The [kill] link in the first column can be used to terminate the connection.
14.1.5.2 Databases
The page shows all the database in the server and for each database it shows the number of tables in that database, the size of the tables, the size of the indexes and the total size of the database.
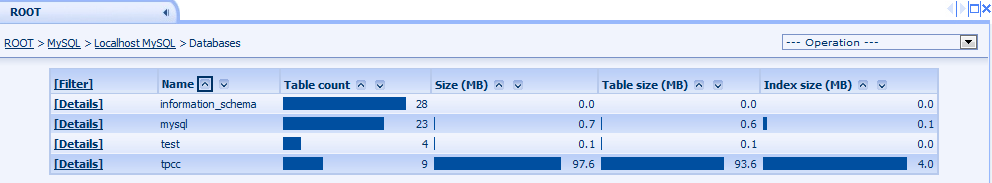
Figure 166. MySQL collector page: Databases
The [Details] link can be used to view every table in that database. After clicking in PVSR shows the Tables page (14.1.5.3), except that it only shows tables in the selected database and so the result table doesn’t have the Database column.
14.1.5.3 Tables
The page shows the tables in the server, along with their size, index size, number of rows and average row length.

Figure 167. MySQL collector page: Tables
The [Details] link can be used to view detailed information about the selected table. The detailed page shows also the database engine used by the table, the version, the character set and the date the table was created. It also shows the indexes defined on the table:
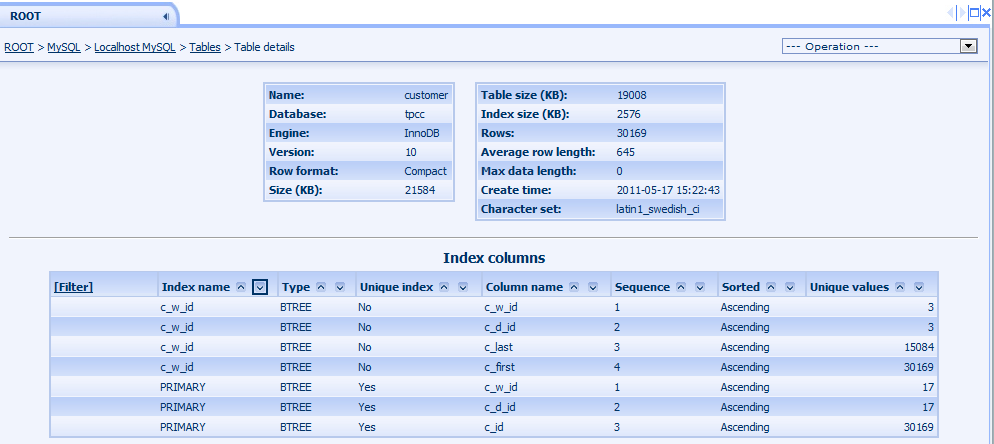
Figure 168. MySQL collector page: Table details
14.1.5.4 Every status variable
The table shows for every status variable their current values and also the value change since the last page refresh. If the user clicks on the [Monitoring] link in a row then PVSR shows three charts with these values for the selected statistic and also the difference divided by the number of seconds passed since the last page refresh.
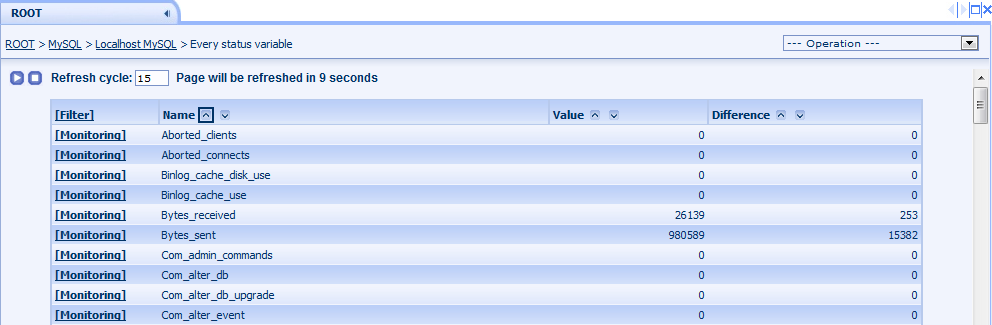
Figure 169. MySQL collector page: Every status variable
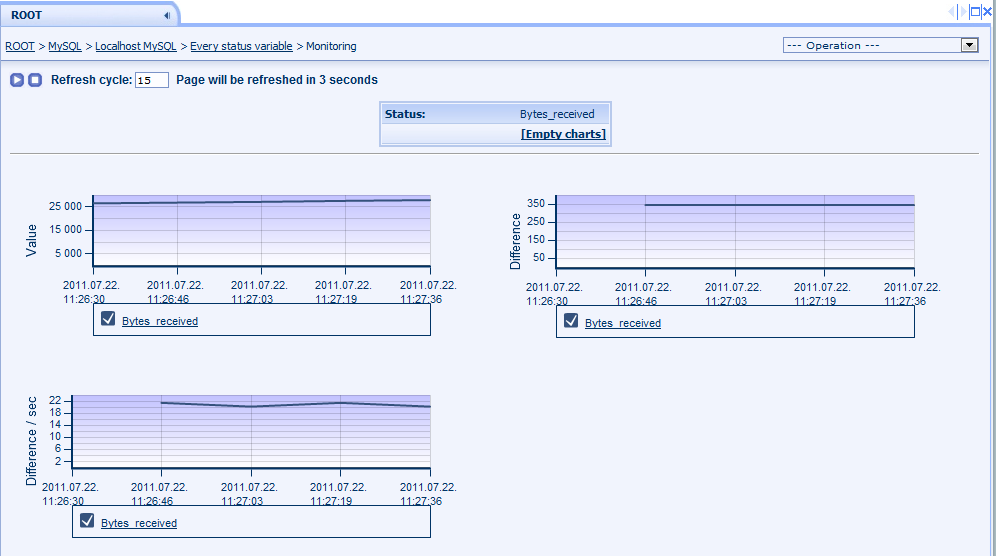
Figure 170. MySQL collector page: Status details
14.1.5.5 Every server variable
The page shows every server variable value:
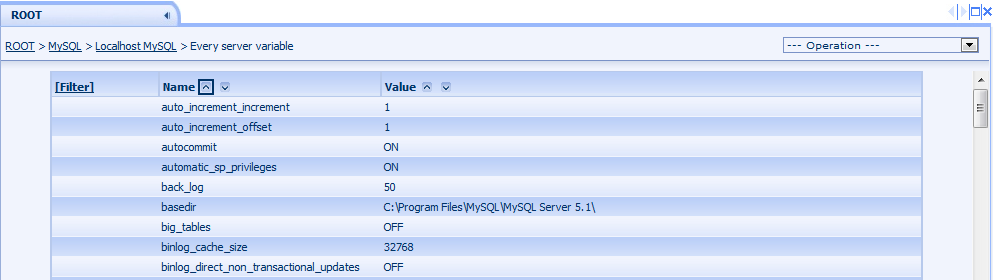
Figure 171. MySQL collector page: Every server variable
14.1.5.6 Custom select
This page is available only to administrator users. The user can specify any select or show statement and the page shows its result in a table:
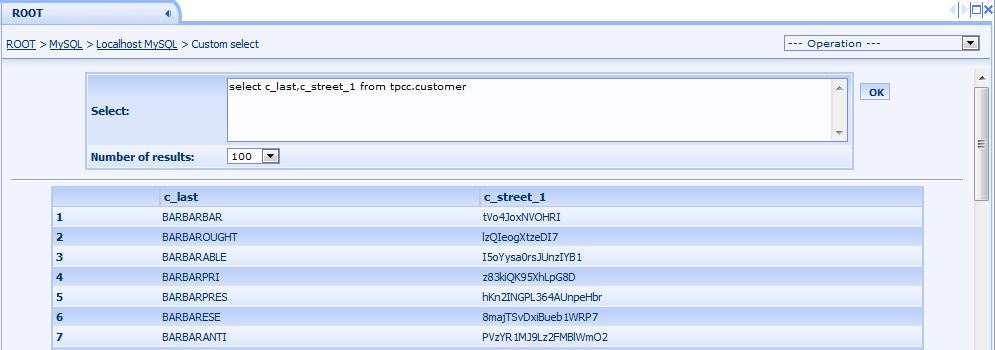
Figure 172. MySQL collector page: Custom select