| Previous | 14.1 Specifics of measurement server types | Next |
|---|
14.1.6 Synthetic transaction monitoring servers
The synthetic transaction monitoring server is an active and non-discoverable PVSR module. The measurement server, except for the e-mail type measurements, takes into account the timeout value specified for the equipment, but retries are not implemented. The equipments have no additional attributes beside their basic ones, as a synthetic transaction monitoring server in PVSR does not necessarily means an actual real piece of equipment, and can execute several transactions of different types and objectives. Regardless, it is recommended to create a separate piece of equipment for example for the HTTP/FTP measurements, another one for each DNS server, and so on, to make the created structure unambiguous for the user.
Since the synthetic transaction monitoring server is non-discoverable, the individual measurements must be created one-by-one with the use interface. The measurement server disregards the value of the Index parameter, which can have any value (but must be specified). However, if accessibility and response time, etc. measurements are also made, then the measurements with the same type (HTTP/FTP, DNS recursive, DNS cache and DNS authoritative) and index are bound together, i.e., contain the accessibility and response time, etc. for the same performed measurement. These measurement types are handled jointly in the PVSR user interface, thus setting parameter values is performed as described in the equipment configuration (for example, if the address of the DNS server is changed for a measurement with type DNS Cache Availability and index DNS1, then the address of the DNS server is also changed for the measurement with type DNS Cache RTT and index DNS1). The HTTP measurements can also be done using HTTPS, although in this case the following additional Perl libraries need to be installed:
· HTTP transaction measurements and Apache measurements: Net-SSLeay-1.36, POE-Component-SSLify-1.005 and POE-Filter-SSL-0.22
· Regular HTTP measurements: Crypt-SSLeay-0.58
The measurement server can perform several kinds of measurements, and for almost all measurement types different parameters must (or can) be specified. The parameters and their corresponding measurements are:
- HTTP measurements: sends HTTP/FTP queries to a specific URL, and measures whether this was successful and the round trip time in milliseconds
- URL address: Single line text field, which can be seen by non-administrators as well. The field contains the URL of the HTTP/FTP to be queried, it is mandatory
- User name: Single line text field, which can be seen by non-administrators as well. The field contains the user name used for the query. If it is set, then the server performs BASIC or FTP authentications with the specified value. If the user is authenticated using NTLM, then this parameter value must be in the format DOMAIN\USER
- User password: Single line text field, which cannot be seen by non-administrators. The field contains the password of the user used for the query. If it is set, then the server performs BASIC or FTP authentications with the specified value
- Proxy: Single line text field, which can be seen by non-administrators as well. The field contains the proxy specification to be used for the query, and it is an optional parameter
- Searched expression: Single line text field which can be seen by non-administrators; optional parameter. If it is specified, then the measurement is successful only if the specified expression can be found by using regular search on the obtained HTML page. For example, the “This is a.+page” expression can be found, if the page contains the “This is a test page” text on the page.
- Post data: Single line text field which cannot be seen by non-administrators; optional parameter. If it is specified, then PVSR uses HTTP POST instead of HTTP GET and sends the content of this field as POST data
- Apache measurements: PVSR can monitor several Apache related performance indicators. It does this by accessing the server-status page in Apache, so the server needs to be configured in a way that it allows access to this page. This feature is not turned on by default. To enable it, usually the following parts must be changed in the Apache configuration file:
- The “<Location /server-status>” Location part must be uncommented (deleting the # characters). It is important to note that if we uncomment every line belonging to this Location then Apache will allow access from the .example.com domain (Allow line), so either the correct domain must be specified or we can allow access from everywhere by not uncommenting the Deny line
- The “ExtendedStatus On” line should also be uncommented
We can test the settings by getting the http://address_of_the_server/server-status?auto page if we are using HTTP as the protocol. The parameters of the measurements are the following:
- IP address: either the IP address / name of the Apache server (for example 127.0.0.1) or in the format of http://address_or_name or https://address_or_name. If the value is only the name or the address then PVSR uses the HTTP protocol. In order to use HTTPS instead, the second format must be used and the additional Perl libraries have to be installed
- User name: Single line text field, which can be seen by non-administrators as well. The field contains the user name used for the query. If it is set, then the server performs BASIC authentications with the specified value.
- User password: Single line text field, which cannot be seen by non-administrators. The field contains the password of the user used for the query. If it is set, then the server performs FTP authentications with the specified value
- HTTP transaction measurements: These measurements do a series of HTTP requests. These steps are defined in a separate text file which can be uploaded into PVSR. The steps can contain beside the required HTTP requests also validation assertions: the downloaded content can be analyzed using XPATH searches and regular expressions. These expressions can also be used to parse out sub-strings from the content and either represented as separate PVSR measurements or used as parameters in the following steps. Both the steps and the assertions can be critical and non-critical. If a step is critical and it has failed then PVSR will abort the sequence, while if a step is non-critical then it will continue even if the step has failed.
The steps can be recorded and edited using a Firefox plug-in. The description of this plugin can be found in a later section: 14.1.6.2 HTTP transaction measurement configuration.
Several different measurements can be created in PVSR for the same step sequence. These measurements evaluate a section from the sequence. A sequence is executed only once for each measurement interval, even if there are several PVSR measurements for it for different sections.
Parameters:
- Script: Drop-down list with the uploaded test scripts
- First measured step: The first step of the step sequence section. If it is left empty then the section begins at the first step. The user can also name the steps and these names can also be used here
- Last measured step: The last step of the step sequence section. If it is left empty then the last step in the sequence will be the last step for this measurement. The user can also name the steps and these names can also be used here
Measurements:
- HTTP Transaction Time: The cumulative execution time of all steps in the sequence in msec
- HTTP Transaction Bytes: The cumulative downloaded data of all steps in the sequence
- HTTP Transaction Success Rate: The percentage of successful assertions among all executed assertions. The total number of assertions consists of the number of steps (successful if the HTTP transaction was successful) and the number of assertions on the downloaded contents. If an assertion is not executed because of a previous failed critical assertion or because of a previous timeout then it is also considered as failed. Examples:
Even the first step was not executed because of a previous error:
Measurement result =0
Every step and assertion was successful:
Measurement result =100
Even the first step was not executed because the script had a syntax error, or the first step was later in the test sequence as the last step, or no step with the given name existed in the sequence:
Measurement is not successful
Additional examples: let’s assume the following steps:
1. step: 3 assertions
2. step: 0 assertion
3. step: 2 assertions
If the first assertion in the first step is unsuccessful and the content cannot be downloaded in step three then the result of the measurement is:
Sum of assertions: 3 steps + 5 assertions =8
Failed assertions:
1. step: 1 assertion: 1
3. step: 1 step + 2 assertions: 3
Measurement result = (1+3)/8 = 50%
- HTTP Transaction Failed Step: the first step in the step sequence section where the content could not be downloaded. If neither of the steps were executed then the measurement will not be successful. If the execution was aborted because of a failed assertion on the content then the measurement will also be unsuccessful. If there were no download error then its value will be 0, otherwise it will be the absolute step number (and not the number of the step in the sequence section). Examples:
There wasn’t any error:
Measurement result =0
Error during the download of the page in step N
Measurement result = N
The first step was not executed because of a previous error:
Measurement is not successful
The next step was not executed because a critical assertion failed:
Measurement is not successful
- HTTP Transaction Failure Location: the location of the first download error or unsuccessful assertion. If there wasn’t any error then its value is 0. If the download was unsuccessful in step N then its value will be 100 * N, otherwise its value will be 100 * N + the number of the first failed. If the first step was not executed because of a previous failed critical assertion then the measurement is not successful. Examples:
There wasn’t any error:
Measurement result =0
Error during the download of the page in step N
Measurement result = N * 100
Error during the M. content assertion in step N:
Measurement result = N * 100 + M
The first step was not executed because of a previous error:
Measurement is not successful
- HTTP Transaction Failure Code: The first error code during the step sequence section:
- If there wasn’t any error then 0
- If the error occurred during the page download then the HTTP error code
- 601: client side error, typically DNS problem
- 602: the sequence exceeded the available time to do the measurement
- 700: one of the assertion was unsuccessful
- If the first step was not executed because of a previous failed critical assertion then the measurement is not successful.
- HTTP Transaction Custom Measurement1-5: In every script the user can create several assertions and store the result of the regular expression in a named variable. If the variable is named CustomMeasurement1, CustomMeasurement2…, then its value can be used as a PVSR measurement value. The measurement is only successful if the parsed out substring is a number.
Remarks and restrictions regarding these measurements:
- The basic http authentication is supported. The user name and password must be stored in the test script. If a user name/password is present in a step then PVSR will use that in further steps as well until a different value is given
- The value of the User Agent HTTP parameter is set also in the test script
- The system handles the browser cookies
- The system handles the redirections up until 10 redirection steps
- The test HTTP client uses the HTTP 1.1 protocol
- Proxy is not supported
- FTP upload and download measurements: These allow to either download or upload a file using FTP and measure the bandwidth in bytes per second. The parameters:
- Server: address of the FTP server
- Port: FTP port, by default 21
- User name: optional FTP user name
- User password: optional FTP user password
- Passive: should the FTP transfer be passive FTP or not. By default it is set to passive
- Operation: either GET (download) or PUT (upload)
- File: the name of the file to download or upload. In the first case it must be a valid file name with path on the FTP server, in the second case it must be a valid file name with path on the PVSR server
- DNS recursive measurements: Maintains a configuration file that contains several thousand domain names ending with .hu or .com. The measurement server selects one of these randomly, and performs an NS-type DNS request for it. If a response is given, then the DNS server is 100% accessible, and the response time is the time measured in milliseconds. If the response says that the given domain does not exist, then a counter is incremented in the configuration file. If this counter reaches 5, then this domain will not be selected any more. If the response says that the given domain exists and its counter was nonzero, then the counter is reset to zero, that is that domain name starts with a clean sheet.
- DNS server address: Single line text field, which can be seen by non-administrators as well. The field contains the address of the DNS server to be queried, its specification is mandatory
- DNS test file: Drop down menu, which can be seen by non-administrators as well. The field contains name of the file holding the domain names to be tested, its specification is mandatory
- DNS cache and authorative measurements: The queries the specified domain names from the DNS server. It executes an NS-type query for the cache (that is, the given entry is never removed from the cache, that is the response time is the cache lookup time), or an A-type query for the authorative case, respectively.
- DNS server address: Single line text field, which can be seen by non-administrators as well. The field contains the address of the DNS server to be queried, its specification is mandatory
- DNS entry: Single line text field, which can be seen by non-administrators as well. The field contains the domain name for the query (see below), its specification is mandatory
- E-mail measurements: the test sends an e-mail with SMTP to the specified address, then it observes with POP3 whether it has arrived to the server. It measures the successfulness of this process and the response time, the latter one in seconds. For e-mail queries – because of their long lasting nature – the query system does not use the timeout values specified on the equipment level. Instead it waits for the 3rd second before the end of the measurement cycle. The execution of e-mail measurements is different from that of other measurements: if they exist, then the system tries to complete them first by waiting maximum 10 seconds for the e-mail to arrive in cases of measurement cycles of one minute or shorter, and up to 60 seconds in the other cases. If this timeout has expired, then after finishing each other measurement it checks whether the e-mail has arrived. Because of this functionality, if the measurement cycle is one minute long and the mail has not arrived in 10 seconds, and another measurement (e.g. DNS) is not successful because of a timeout, then the next time the system checks the arrival of the e-mail is after the end of the timeout. This means, that if the timeout is 5 seconds, then it does not matter whether the mail arrived in 11 seconds, the measured value will be 15 seconds.
- SMTP server: Single line text field, which can be seen by non-administrators as well. The field contains the address of the SMTP server used for sending, it is a mandatory parameter. If the parameter value is of the form host:465 then PVSR uses an SSL connection
- E-mail address: Single line text field, which can be seen by non-administrators as well. The field contains the recipient of the e-mail, it is a mandatory parameter
- POP3 server: Single line text field, which can be seen by non-administrators as well. The field contains the address of the POP3 server, where the mail should arrive, it is a mandatory parameter. If the parameter value is of the form host:995 then PVSR uses an SSL connection
- POP3 user name: Single line text field, which can be seen by non-administrators as well. The field contains the POP3 user name, it is a mandatory parameter
- POP3 user password: Single line text field, which cannot be seen by non-administrators. The field contains the POP3 user password, it is a mandatory parameter
- DHCP measurements: sends a DHCP Request to a DHCP server with the specifying IP and MAC address of the requesting machine. For normal operation, it is recommended to set the IP-MAC pair statically. If the Realty agent IP address is set and it is neither „0.0.0.0”, nor is it the same as the IP address, then the requesting system acts as a Relay agent, that is if the DHCP server is not in the subnetwork of the PVSR server, then the Relay agent IP address always has to be specified. According to the DHCP protocol mechanism, the reply arrives from the DHCP server on the bootps(67) local port for the Relay agent function, and on the bootps(68) port for the non Relay agent. Therefore, on Unix/Linux systems we have to run the synthetic transaction measurement server as a root user. It measures the successfulness and the response time, the latter one in millisecond.
- DHCP server: Single line text field, which can be seen by non-administrators as well. The field contains the address of the DHCP server, it is a mandatory parameter
- IP address to be queried: Single line text field, which cannot be seen by non-administrators. The field contains the IP address of the client machine used for the request, it is a mandatory parameter
- MAC address to be queried: Single line text field, which cannot be seen by non-administrators. The field contains the MAC address of the client machine used for the request, it is a mandatory parameter
- Relay agent IP address: Single line text field, which cannot be seen by non-administrators. The field contains the address of the Relay agent used during Relay agent type operation. This coincides with the address of the PVSR machine only if there is no address transformation (NAT). It is an optional parameter
- NTP measurements: Queries the data of the specified NTP server, and returns different calculated statistics:
- Availability: Similarly to the other measurements, its value is 100 for success, and 0 otherwise.
- Peer Delay: The DNS process time is subtracted from the request time, in millisecond
- Root Delay: The access time of the NTP server with respect to the root NTP server, in millisecond
- Root Dispersion: NTP server dispersion with respect to the root NTP server, in millisecond
- Sync Distance: The distance calculated from the two parameters above: (Root Delay)/2 + Root Dispersion
- Stratum: The distance of the NTP server from the root NTP server. A 0 value indicates that there is no such root server. This can mean an error but also that the NTP server has started only at the moment and could not yet synchronize itself.
For NTP measurements, there is only one parameter which can be specified, and that is the address of the NTP server. It is a mandatory parameter, and it can be seen by non-administrators as well.
- SSH measurements: opens an SSH connection on the server. It measures the successfulness and the response time, the latter one in milliseconds.
- SSH server: Single line text field, which can be seen by non-administrators as well. The field contains the address of the SSH server, it is a mandatory parameter
- User: Single line text field, which can be seen by non-administrators as well. The field contains the user name required for logon, it is a mandatory parameter
- Password: Single line text field, which cannot be seen by non-administrators. The field contains the password required for logon, it is an optional parameter. If it is not specified, then the measurement is successful only if key based authentication is set up.
- TCP measurements: opens a TCP connection on the given port of the given server. It measures the successfulness and the response time, the latter one in milliseconds.
- TCP server: Single line text field, which can be seen by non-administrators as well. The field contains the address of the TPC server, it is a mandatory parameter
- TCP port: Single line text field, which can be seen by non-administrators as well. The field contains the TPC port, it is a mandatory parameter
- RADIUS measurements: performs a RADIUS authentication on the given server. It measures the successfulness and the response time, the latter one in milliseconds.
- RADIUS server: Single line text field, which can be seen by non-administrators as well. The field contains the address of the RADIUS server, it is a mandatory parameter
- RADIUS server port: Single line text field, which can be seen by non-administrators as well. The field contains the port to which the system tries to connect, it is a mandatory parameter and its default value is 1812. It is important to note that for certain systems, the RADIUS port is not the one specified here; but instead, the server listens on port 1645
- RADIUS client IP address: Single line text field, which cannot be seen by non-administrators. PVSR uses the value of this field for the NAS-IP-Address, it is a mandatory parameter
- RADIUS secret: Single line text field, which cannot be seen by non-administrators. The field contains the SECRET parameter set on the server, it is a mandatory parameter
- RADIUS user: Single line text field, which cannot be seen by non-administrators. The field contains the user name required for access, it is a mandatory parameter
- Radius Password: Single line text field, which cannot be seen by non-administrators. The field contains the password required for access, it is a mandatory parameter.
- LDAP measurements: opens an LDAP connection with anonymous bind. It measures the successfulness and the response time, the latter one in milliseconds.
- LDAP URI or server: Single line text field, which cannot be seen by non-administrators. The field contains either the address of the LDAP server, or an LDAP URI, which might contain additional user name and password values, in which case PVSR will use those instead of the anonymous bind (e.g.: ldap://user:password@ldapserver.intranet.company.com/). The parameter is mandatory
- AJP ping measurements: these measurements test the Apache JServ Protocol availability. The Index parameter of the measurement can have two types of values:
- <host>:<port> PVSR connects to the host and port
- <host> PVSR connects to the host using the default port 8009
- SSL certificate measurements: the system measures the availability + connection time of the server and how long the certificate remains valid. The Index parameter of the measurement can have two types of values:
- <host>:<port> PVSR connects to the host and port
- <host> PVSR connects to the host using the default port 443
- <file_path> PVSR uses the local certificate file to do the measurements
- Command measurements: Beside the above measurements, the synthetic transaction measurement server facilitates the execution of any availability-response time type measurements with the help of these measurements. The measurements have only one parameter, the Command line parameter to be executed, which is obligatory and it can be seen by non-administrator users as well. The measurement server starts the program, the current directory is the bin directory of the PVSR, and it waits for the execution of the command as long as specified in the equipment. If the program does not finish, then the Availability value is 0 and the measurement server terminates the program with a SIGKILL signal. The measurement is successful if the program writes only one line to its standard output (by not counting some possible empty lines) which contains either a decimal number or two decimal numbers separated by the “,” character. In the first case the Availability value is 100 and the RTT value is the returned number which is displayed in millisecond on the PVSR interface, in the second case the value of the availability comes from the second decimal number. If the output of the program does not match the format described above, then the output is recorded in the log of the measurement server, which allows the program writer to send error messages.
- Nagios measurements: the synthetic transaction measurement server facilitates the execution of any Nagios plug-in. There are two measurement types: Check and Availability. The first gets the exit code value of the Nagios plug-in (0 if it is OK). The Availability is 100 if the exit code is 0 and 0 otherwise (there was an error of some kind). The textual output of the Nagios plug-in is also saved into a separate table in the Oracle database. Several condition governs whether the textual output will be saved as a new entry or PVSR updates the last entry in the database. PVSR updates the entry only if there wasn't a gap in measurement cycles (i.e. the data collector wasn't stopped for a long time) and the exit code is the same. If these are true but the textual output of the plug-in differs from the previous result then it depends on the "Save state changes only" option: if it is set then PVSR will do an update in this case as well. The textual results are stored for the syntethic transaction equipment and they are deleted according to its data retention policy
- NAGIOS: Single line text field, which cannot be seen by non-administrators. It is an optional parameter and contains information about the server running Nagios in the form of user@address (for example nagios@localhost). If it is set then PVSR opens an SSH connection using key-based authentication and runs the plugin there. If the field is empty then PVSR runs the script itself on its server
- Group: Single line text field, which can be seen by non-administrators. Mandatory parameter. PVSR groups the Nagios plugins together based on the value of this parameter and displays them together on its Nagios alarm console view
- Command: Single line text field, which cannot be seen by non-administrators. Mandatory parameter. It must contain the Nagios plugin with full execution path and with the complete parameter list, for example: /usr/local/nagios/libexec/check_ping -H 192.168.1.1 -w 5,90% -c 10,90%.
- Save state changes only: Checkbox field, which cannot be seen by non-administrators
14.1.6.1 Nagios alarm console
PVSR has a separate page to show the Nagios plugin states and textual results. If we open under the Measurement menu an equipment or a virtual equipment which has Nagios measurements then the Operation drop-down list has a new item called Nagios alarms.

Figure 173. Nagios alarms - Real time view
The page has two operation mode:
· Real-time: the last execution state of the plugin is shown. The page is periodically refreshed. At the top of the page we see a table showing the current number of alarm states. Below that is a table showing the Nagios plugins grouped by the Group parameter. The [view] link can be used to quickly display the state changes of that plugin for the last 24 hours. The sequential entries are grouped together if they have the same exit code and the From field comes from the first entry, while the To and the message fields from the latest entry. The [view] link can be used to view the individual entries in the sequence and the [ack] link can be used to acknowledge every entry in the sequence.
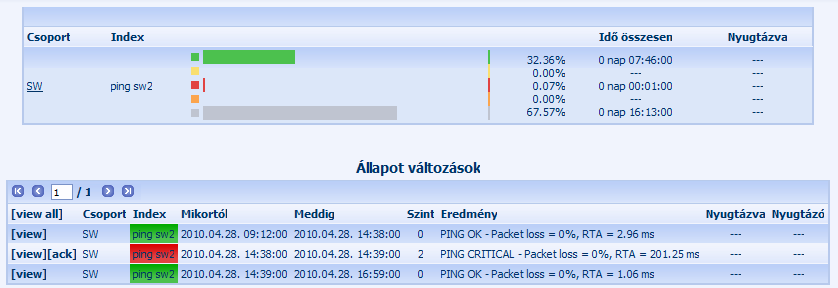
Figure 174. Nagios alarms - Time span view
· Time span: At the top of the page we see a table showing a statistics for every Nagios plugin and for the selected time span: the time the plugin was at a given state as well the time when the plugin state was indetermined (for example the collector wasn't running). Below that is a table showing the state changes for the plugins, the [view] and [ack] links are similar to the previously mentioned ones. The [view all] link can be used to see every message.
14.1.6.2 HTTP transaction measurement configuration
14.1.6.2.1 Uploading the scripts into PVSR
If we open a synthetic transaction equipment in the menu Settings => Site and equipment modification then the Operations list contains two additional entries:
o WEB transaction script editor
o WEB transaction Firefox plugin
The “WEB transaction script editor” page can be used to upload and download the test scripts. Every script has an internal ID and a name and the name appear on the user interface when configuring a measurement. If a script has a syntax error then it is shown with a red background in the table
The “WEB transaction Firefox plugin” item can be used to download the Firefox script configuration plugin. The browser has to be restarted after the download. The plugin is enabled by default, it can be disabled or uninstalled in the Firefox plugin configuration menu
14.1.6.2.2 Firefox script editor plugin manual
The UI has two separate parts: the toolbar under the Firefox URL bar and the sidebar which appears on the left side of the browser.
Toolbar: it contains the following buttons:
- Record: Clicking on the button starts the recording of the requests sent out by the browser (for all tabs). The previously recorded entries will not be deleted
- Stop: Stops the recording
- Clear: Erases all previously recorded entry
- Save: Saves the configuration to a text file. A popup window is displayed after clicking on it where we can specify the destination file name
- Load: A popup window is displayed where we can select the script file we want to open

Figure 175 Toolbar
Sidebar: it contains the following elements:
- Step editor: This shows all the steps. The first column is the number of the step, the second is the type of the request (POST or GET) and the third shows the requested URL. Clicking on a step loads its data into the other elements and the downloaded content is shown in a Firefox tab. The layout and look of this tab can be different from the one seen during regular browsing, because it does not apply the CSS formatting to the page and also does not run any client side javascript. If the “No content” message is shown in the tab then it either means that no content was downloaded during that step or we loaded the script from a text file and haven’t played it yet using the Play button.
The following buttons are shown below the step list: - Delete: Deletes the selected steps
- Save response header: Saves the received header for this step into the plugin directory
- Save response HTML: Saves the received content for this step into the plugin directory
- View source: Shows the source of the received content in a new Firefox tab
- Play all steps: Plays all the recorded steps. The result is shown in a new Firefox tab, break down into steps.
- Copy URL to clipboard
- Select matching steps: select those steps where the URL matches the regular expression in the “Exclude urls” field
There is an „Exclude urls” text box below the buttons: the plugin will disregard any URL during the record process which matches this regular expression

Figure 176. Step list
There are three tabs below the Exclude urls field:
- Step HTTP Data: The data for the selected step is shown here
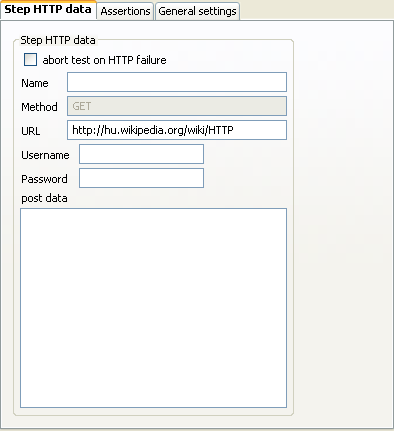
Figre 177. Settings for a step
- Abort test on http failure: If set then this steps is critical, i.e. if the HTTP answer code is not “200 OK” then the sequence is aborted
- Name: Optional field, its value can be used during the PVSR configuration
- Method: Not editable, its value is either GET or POST
- URL
- Username: If set then the application will use it for authentication, also in further steps
- Password: The password belonging to the user name
- Post Data: The posted data during this step. If the Content-Type of the post is „application/x-www-form-urlencoded”, then its content is made up of key-value pairs and it can be edited as such, otherwise it can be edited as a text field
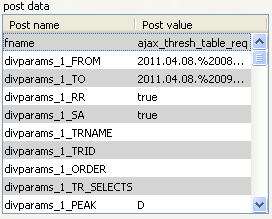
Figure 178. Post data
- Assertions: The assertions for the selected step

Figure 179. Assertion editing
- Step assertions table: This shows the assertion created so far for the selected step. An assertion can be renamed by double-clicking on its name
- Add new: Adds a new assertion
- Delete: Deletes the selected assertion
- Test: We can test the assertion with this button. If the XPath, regular expression and variable declaration do not contain errors then we get a pop-up window like this:
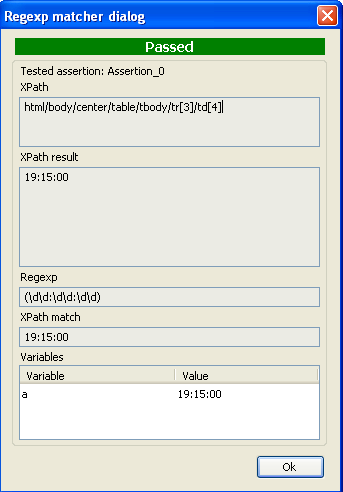
Figure 180. Test result
- The first row contains wither Passed or Failed
- Tested assertion: the name of the assertion
- XPath: the XPath expression used during the test
- XPath result: the result of the XPath expression
- Regexp: the regular expression used
- Variables: the defined variables and their values
- Critical: abort test on assertion failure: if the checkbox is set then this is a critical assertion, i.e. if it fails then the sequence is aborted
- XPath: the assertion searches the page content using this XPath. The fields is freely editable. If its color is red then the XPath is invalid, if its color is orange then it is valid but to not match anything. Otherwise the content is valid and the matched part on the page is marked with a red background
- Return full Inner HTML: if this checkbox is not checked then the XPath result contains only the text part of the inner HTML of the matched tag (concatenated if there are more than one such content). Otherwise it contains the whole inner HTML
- XPath from HTML: this can be used to select an item on the page and copy its XPath to the input field. Its label changes to „Click an element in HTML” once it’s cliked
- Regexp: the regular expression used on the result of the assertion. The variables are the match groups, so for example if we want to select a time and name its value as V1 then we can use for example the regular expression (\d\d:\d\d:\d\d) and put V1 into the Variables field
- Variables: Comma separated values of variable names used to name the match groups. It is important to notice that the same variable name cannot be used more than once, in the same or in any other assertions. The variable names can be used in POST data and in the URL of a step with the syntax $name_of_the_variable$, so for example if the variable is named myVariable1 then $myVariable1$
- Global settings: The global settings of the Firefox plugin

Figure 181. ábra Global settings
- User-agent: the value of the User-agent field used during play back
- Webvisor version: the version number of the Webvisor plugin