| Previous | 14.1 Specifics of measurement server types | Next |
|---|
14.1.24 PostgreSQL measurement servers
The PostgreSQL measurement server is an active and discoverable PVSR module. The measurement server takes into account the timeout value specified for the equipment. Beside the basic attributes, the equipment has the following additional parameters (the code of the parameter is given in parenthesis; see Subsection 7.5.6 on Parameters of non-SNMP data collectors):
· Host (POSTGRES EQ 1 HOST): the host where the PostgreSQL database is running. Mandatory parameter
- Port (POSTGRES EQ 2 PORT): the database listening port. Mandatory parameter, its default value is 5432
- User (POSTGRES EQ 3 USER): the database user used for monitoring. Mandatory parameter
- Password (POSTGRES EQ 4 PASSWORD): password of the database user. Mandatory parameter
- Database (POSTGRES EQ 5 DATABASE): PostgreSQL database used in the connection. Optional parameter
- PostgreSQL version (Z 01 VERSION): the version of the PostgreSQL database. Non-modifiable automatically discovered parameter
The system contains the following measurement types:
· Autovacuum freeze
· Buffers allocated
· Buffers written by backend
· Buffers written by background writer
· Buffers written by checkpoint
· Database size
· Hit Ratio
· Lock number
· Max number of connections
· Number of active connections
· Number of backends
· Requested checkpoints
· Scheduled checkpoints
· Tablespace size
· Uptime
· WAL files
The data collector also contains a non-discoverable measurement: user can create custom select measurements. The select statement has to give back one row and only one column in that row. PVSR will display the result of that statement as a value.
PVSR contains multiple diagnostic pages for the PostgreSQL databases:
· 14.1.24.1 Size of tables
· 14.1.24.2 Size of indexes
· 14.1.24.3 Database activity
· 14.1.24.4 Users
· 14.1.24.5 Bloat
· 14.1.24.6 Last ”Vacuum” time
· 14.1.24.7 Last ”Analyze” time
· 14.1.24.8 Database run-time parameters
· 14.1.24.9 Explain plan
· 14.1.24.10 Custom select
14.1.24.1 Size of tables
The page shows the tables in the database and their size

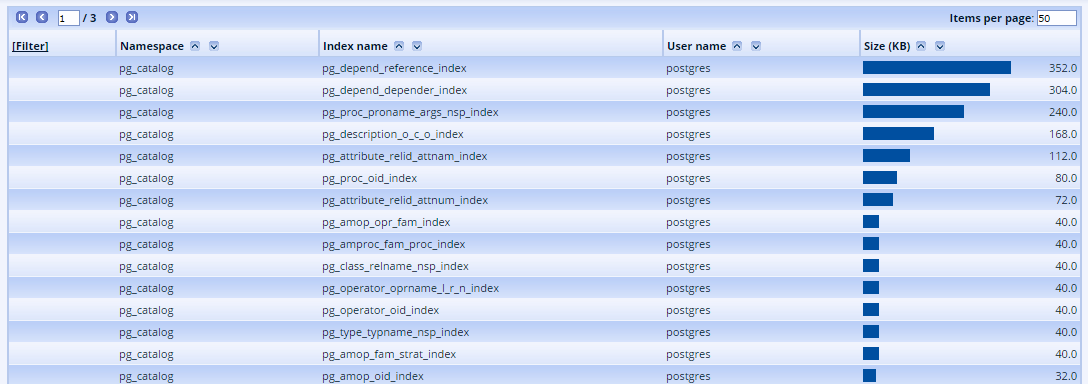
14.1.24.2 Size of indexes
The page shows the indexes in the database and their size
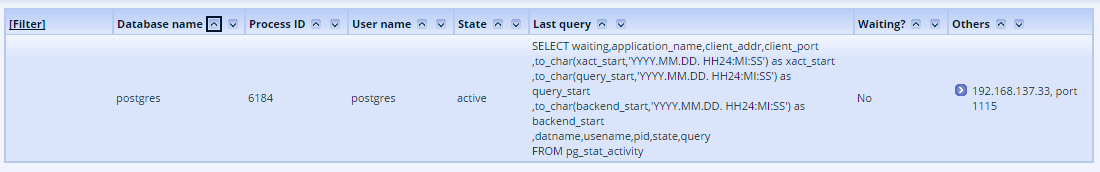
14.1.24.3 Database activity
The page shows the currently executed SQL statements along with other parameters like the name of the database, the name of the user, whether the session is waiting, client and start times (process, transaction and query)
14.1.24.4 Users
The page shows the users in the database

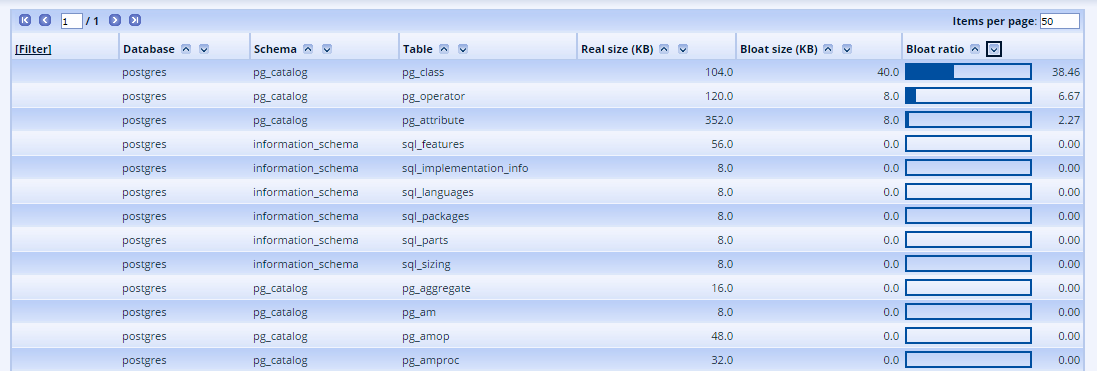
14.1.24.5 Bloat
The page shows the bloat value of the tables and indexes. The bloat is usually space claimed by a table or index which is not really used by it. The space can be reclaimed with the (auto)vacuum PostgreSQL command.
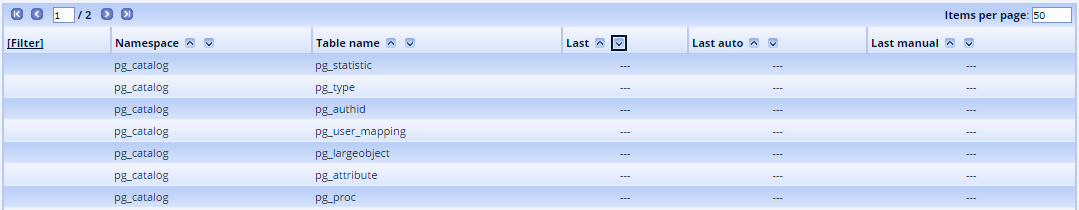
14.1.24.6 Last ”Vacuum” time
The page shows the last time the vacuum was run, either manually or automatically.

14.1.24.7 Last ”Analyze” time
The page shows the last time the analyze was run, either manually or automatically.
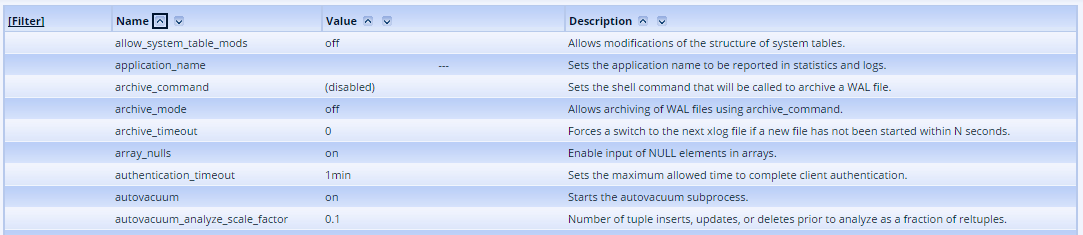
14.1.24.8 Database run-time parameters
The page shows all the database parameters and their values
14.1.24.9 Explain plan
The page shows the explain plan for any custom select statement.

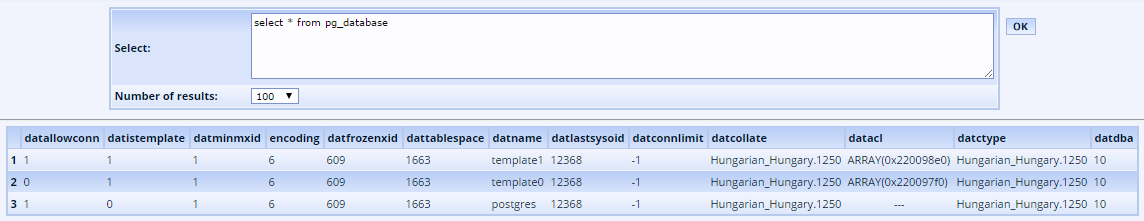
14.1.24.10 Custom select
The user can specify any select statement and PVSR shows the result of it. The page can only be used by the administrators.