| Previous | 14.1 Specifics of measurement server types | Next |
|---|
The Proxy measurement servers are not like the other measurement servers, because their purpose is not data collection, but enabling a special relationship between the central PVSR modules and the PVSR data collector engines.
Normally for each measurement server PVSR has to be able to open an SSH connection to the server they are running on and they must be able to open an Oracle connection back to the Oracle server used by PVSR. In addition the actual machines the measurement servers are running on must be normal x86 architecture machines (physical or virtual).
The Proxy measurement server addresses both issues:
· Connections only need to able to be established in one direction, either from PVSR to the actual collectors or from the collectors to PVSR
· The actual collectors can run also on small openwrt-based devices
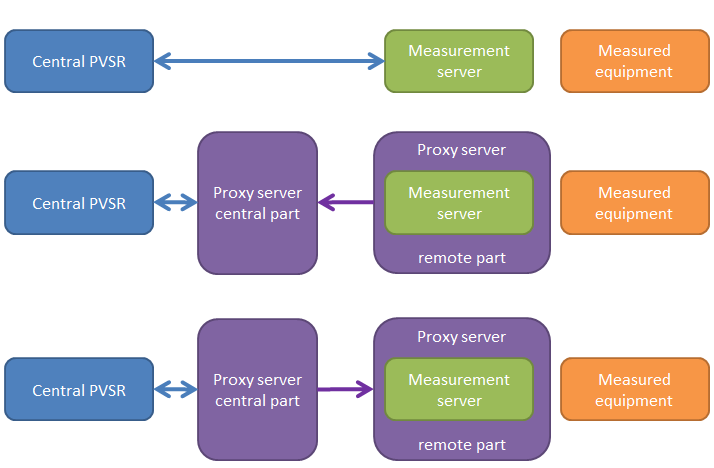
The first case shows a normal data collection case, the second with only uplink communication and the third with only downlink communication. In the proxy cases the proxy is split into two parts. The central part operates as a normal data collector, with the same needs as a normal data collector: bidirectional communications and an x86 server. The remote parts are presented as proxy equipments in PVSR, and the normal equipments have to be manually assigned to them and not to the normal measurement servers. As a matter of fact in this case the normal measurement servers are not even present in PVSR: the remote part of the proxy configuration automatically determines which collection engines it must start based on the equipments assigned to it.
In the second case, when the downlink communication is not enabled, the discovery of available measurements are bit more complicated then usually. First of all: the discovery only works if the proxy measurement server is running on the same machine as the PVSR WEB interface. Since downlink communication is not enabled if the user creates a new equipment – for example an SNMP equipment – on the PVSR user interface then the proxy cannot immediately notify the remote part about this. Eventually the remote part will connect to the central part and it will be notified about the new device, but until then when the user wants to modify the equipment he will receive the error message:
The equipment was still not discovered by the Proxy!
An other problem might occur if someone creates a new type of measurements or modify an existing one. In this case for each equipment the user will receive the following error until it is rediscovered by its proxy:
The equipment discovery was done too long ago and some measurement type definition had been changed since that!
After the installation none of the measurement servers are enabled for Proxy collection. To enable them the user first must create at least one Proxy equipment, open it in “Site and equipment configuration”, select the “Enable Proxy collection” from the Operation drop-down list, check the needed checkboxes and save it by clicking on the OK button. For every enabled measurement server types the equipments will have a new parameter called Proxy and the users can assign equipments to proxies using that parameter. If a proxy is selected then the user cannot specify the collector server group. The “Currently without a Proxy” value for this parameter means that the equipment should be collected through a proxy but currently no such proxy exists in the system (for example it was deleted).
There are two additional special elements in the Operation drop-down list for proxy equipments:
· Show equipments assigned to this probe: it displays a list of all equipments assigned to it
· Load late arrived Proxy results: this has the same functionality as the Servers => Load late arrived results, except that it can be used to load or delete late files coming from remote proxies. It is important to mention that it does not matter which proxy equipment we choose to open this page, we will be able to manage the late arrived results from every proxy equipment
Each remote proxy equipment has the following additional parameters (the code of the parameter is given in parenthesis; see Subsection 7.5.6 on Parameters of non-SNMP data collectors):
· MAC address (MINIPROBE EQ 1 MAC): The MAC address of the remote proxy equipment. The central part of the proxy server identifies the proxies with this parameter
· IP address (MINIPROBE EQ 2 IP): The IP address of the remote proxy. The central automatically synchs it when communicating with the remote proxy using the uplink communication mode
· User (MINIPROBE EQ 3 USER): Name of the user used by PVSR to log into the remote server using SSH. The parameter is required of the downlink communication is enabled, otherwise it is not used
· Password (MINIPROBE EQ 4 PASSWORD): The password to use with SSH. If it is not specified then PVSR uses key-based authentication
The proxies have several parameters in the CONFIG_INI.pm files both on the central side and on the remote side.
Common parameters: these must have the same value on both sides. At least one of the first two values must be set to 1. If both values are set to 1 then PVSR will use the uplink mode for sending the measurement results into PVSR but it will use the downlink mode for running the equipment discoveries
· MINIPROBE_DOWNLINK_ENABLED: if it is set to 1 then the central part can connect to the remote part
· MINIPROBE_UPLINK_ENABLED: if it is set to 1 then the remote part can connect to the central part
· MINIPROBE_PORT: the TCP port the central or the remote proxy part is listening on
· MINIPROBE_PASSWORD: an optional password parameter. If it is not set then anyone can connect to the proxy server
Remote part parameters:
· MINIPROBE_EXCLUSIVE_MODE: if it is set to 1 then at any time only one data collector is running measurements for one collection cycle. The parameter should be set to 1 if the remote part is running on a small openwrt device because of the limited CPU and memory resources
· MINIPROBE_EXCLUSIVE_SYNT_MODE: if it is set to 1 then the remote proxy does not try to connect to the central part when a Synthetic transaction measurement is in progress. It should be set to 1 if we are running measurements which uses the uplink of the remote device (for example FTP-based bandwidth tests)
· MINIPROBE_ENABLE_NAGIOS_LOG: if it is set to 1 and we are running Nagios measurements on the remote side then it will try to connect to the central Oracle anyway to insert Nagios test results. Without this PVSR will only contain Nagios measurement values but it will not contain the text output of the Nagios commands. The option is not supported on openwrt devices
· MINIPROBE_INTERFACE4MAC: the interface name the remote part uses for the MAC address to identify itself with the central part
· MINIPROBE_HOST: the IP address of the central part, only used if the uplink communication is enabled
Central part parameters:
· MINIPROBE_ENABLE_REALTIME: if set to 1 and the downlink communication is enabled then PVSR allows the real-time mode for the charts on the user interface. It is strongly recommended to set it to 0 for openwrt devices due to limited CPU and memory resources
· MINIPROBE_PROXIES: the parameter is only used if the uplink communication is not enabled: the central part starts this many processes to communicate with the remote proxies
· MINIPROBE_PROXY_PARALLEL: the parameter is only used if the uplink communication is not enabled: each proxy process communicates at any time maximum with this many remote proxies
The equipment representing the remote proxy also has measurements on its own:
· When was the last result file, measurement and measurement type configuration request received
· The number of measurement files expected and received by the probe. This measurements exists for all data collection cycle, but they only provide valid data if they are created with the same data collection cycle as they are measuring, so for the 1 minute files with 1 minute collection cycle, for the 5 minutes files with 5 minutes collection cycle, etc…
· The time on the remote part and the difference between the time on the central part and the remote part
· Memory and load measurements
· Uptime: when was the remote proxy part started