| Previous | 4 Users and their settings | Next |
|---|
4.3 Preferences
There are three levels of preferences settings:
· Default preferences
· User group preferences
· User preferences
If a user changed his/her preferences then those apply, otherwise the preferences settings of his/her user groups (if belongs to a group), otherwise the default preferences apply. The default and the group preferences can be configured on the “Group preferences” page while the user preferences on the “Preferences” page. In each case the menu has a single page only. By clicking on the “OK” button the modifications can be saved and the page is refreshed with the modified data. The “Reset to default” means the deletion of the preferences setting for the user group and user level and the reverting to the installation default for the default preferences level.
The page contains multiple tabs, clicking on the OK button saves the changes made to any one of them. It is important to note that some of the settings only come to affect when the whole PVSR page is refreshed. The different preference groups and their parameters are the following:
Generic
- Language: the language used for the labels and messages on the UI. The setting is only available if the authentication method used does not support logging out. Otherwise the language can be changed on the login screen by clicking on one of the language icons. It is important to notice that this setting won't affect the different texts stored in the database. For example: even if the user changes its value to Hungarian, the measurement type "Processor usage" will remain "Processor usage" and any measurement created with this type will have the name "Processor usage"
- Object view: selects the default view for the site and equipment configurations. For every page the view can be changed temporarily with the small icons located on the top of the page.
- Icons: Large icons representing the sites and equipment, five of them are displayed in a row.
- List: Small icons representing the sites and equipment, five of them in a row
- Detailed: a single element per row display with the following columns:
- First column: The element icon, this differentiates the equipments from the sites
- Name: The name of the element
- Description: The description of the element
- Equipment data: Used only for equipments, contains all measurement server specific data of the equipment (e.g. community for SNMP).
- Tree: tree view
- Starting page: The value can be chosen from a scroll down menu:
- Empty: the initial page is displayed for the user after login
- Menu items: the page below the given menu item is displayed for the user after login, its value can be one of the menu items below Alarms and Measurements
- Simple configuration mode: if selected then PVSR offers the simple mode by default (only site and equipment creation)
- Show full hierarchy of for custom submenus: if it is checked and the user opens the ROOT => Site1 => Site2 => Eq1 equipment from the submenu Site2 then PVSR will show the hierarchy ROOT => Site1 => Site2 => Eq1, but if it is not checked then it will show only Site2 => Eq1
- Virtual site-equipment hierarchy: This controls whether the private and public virtual, or the default hierarchy should be displayed below the Measurements=>Current measurements submenu. The possible settings are
- Private and original
- Public and original
- Private, public and original: this is the default
- Only private
- Only public
- Private and public
Chart
· Chart type: The default chart type. The options are: Image or JavaScript
· Measurement chart size: how many chart columns should be shown by default in the Measurement menu. This is just a default setting, which can be changed by clicking on the appropriate icon on the Measurement page Browser area
· Equip actual results chart time span: If the user is viewing an equipment or a public/private chart in real-time mode in the Alarms or in the Measurement menu then the resolution and the automatic refresh time of the charts will be set according to this parameter. This value can be changed for a Measurement page by using the drop-down list on the Browser area below the Real-time ( ) icon
· Number of Javascript chars drawn: how many charts should be drawn on a page. If the user selects less then the browser will need less CPU and memory but when he scrolls the page to a chart which is not drawn then it takes more time to visualize it
· Chart value indicators: The JavaScript based charts are capable to show the actual values for the chart elements:
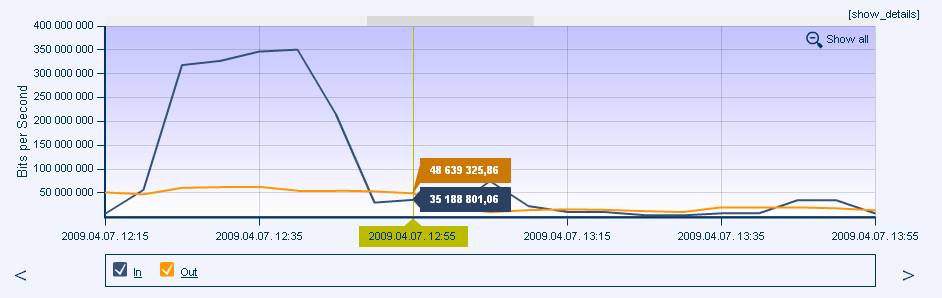
Figure 14. JavaScript chart with values
If this option is set and the chart has four or less elements then by default these values are shown. Regardless of the preference settings the user can turn on and off these indicators any time, see the “Using the JavaScript charts” section for more details.
· Indicator: The default value for the Indicator element in the Chart settings browser group (see Chart settings browsing area)
· Chart zooming: The default value for the Zooming element in the Chart settings browser group (see Chart settings browsing area)
· Y prefix: The default value for the Y prefix element in the Chart settings browser group (see Chart settings browsing area)
· Should the chart background indicate data outage
· Default chart displays: Whether the charts should be expanded or collapsed by default when viewing an equipment or a virtual equipment. The “Reset objects” button can be used to revert every chart to the default mode
Operations
· Show operations: How should the UI shows the operations:
o Only with their icon next to the other operations in a drop-down list and that list also contains the favorite operations (PVSR 4.x mode)
o Only with their icon next to the other operations in a drop-down list and but the list also does not contain the favorite operations
o With their icons and their names next to the other operations in a drop-down list
· Favorite operations: Those operations which have also an icon are displayed here, first in the list those which are selected as favorite operations. The favorite status of an operation can be changed by clicking on the checkbox next to it
Search
· Single select entry: If this option is set, then:
o Under the Measurement and Settings menu Search submenu the object will be immediately displayed if the search has a single result only
o Below the “Current measurements” menu item the page for a given piece of equipment will be displayed immediately if the user has the rights for a single piece of equipment only, furthermore the elements of a site will also be displayed if only a single site could be accessed.
· The quick search feature is looking for name prefix: if it is set and the user uses for example “apple” as a search criteria in the quick-search field (upper right corner of the page) then PVSR will look for “apple*” and not for “*apple*”
· Object types handled by the quick search feature: which objects should be in the quick search result list
· User defined attributes to be used for quick search: the table shows every UDA, displaying those first which are selected (their checkboxes are checked)
Alarm
· Alarm view: the default alarm page mode
· Alarm refresh: When displaying alarms in real-time mode (except when using charts to do so, see below) the application refreshes the information with this cycle
· Alarm window: If viewing the alarms in real-time mode then should the application show only he current alarms or also the alarms from the past time interval
· Level: Which alarm levels should be shown on the Alarms page
· Show ack. too: Whether PVSR should show the acknowledgement alarms by default or not
· Show non violating objects in the Alarms menu: if it is checked then the “Show non violating objects” button is clicked by default in the Alarms menu
· The alarm summary shows this object: the alarm summary on the top of the screen shows statistics for the selected site
· The alarm summary shows only the unacknowledged alarms: the acknowledged alarms are shown with their correct alarm level or as Normal
· The alarm summary shows the Normal state: if it is not checked then the alarm summary does not contain statistics about the Normal state
· Show measured values: if it is checked then the current measured values are shown on the alarm pages in the real-time mode
· Mobile notifications: the user can set whether he wants to receive mobile push notifications or not (if he used the mobile app to login and is specified at thresholds or event definitions). The user can turn off the notifications or choose from two options: receive separate notifications for every threshold violations or events OR receive just one notifications for thresholds and separate notifications for every event definition type.
· Site and equipment unknown grouping: the default value for the fields on the Alarm pages can be configured here
Sound notifications
The items here can be used to specify an alarm sound which PVSR will play when a new alarm event occurs. There are three main options for this feature: do not play any sound at all, play the specified sound if any new alarm occurs or only play the sound if the currently active tab shows an alarm list in the real-time view and the new alarm matches the optional filtering set on that tab. The user can specify separate alarm sounds for the different alarm levels (Critical, Major, …), but before being able to do so an user with administrator priviliges must first upload the required sound files onto the PerformanceVisor server, since by default PerformanceVisor does not contain any alarm sounds. These can be uploaded using the Settings => Customization => Alarm sounds menu (see section 6.9.4)
Key bindings
Here the user can change his key-bindings on this page and turn them on/off. To set a new value, first click in the editable text field and then press the desired key combination.
Date and time
· Hide the popup calendar if the mouse is not above it: if it is not set and the user uses the popup calendar on the Alarms or Measurements page for selecting a custom timespan then the calendar remains visible until the user actually selects a day. Otherwise it disappears when the mouse cursor is not above it
· Time zone: The default time zone for the Alarms and for the Measurements menus