| Previous | 9 Using the charts | Next |
|---|
9.3 Using the image charts
This figure shows the same measurement with the same data as the JavaScript chart above:
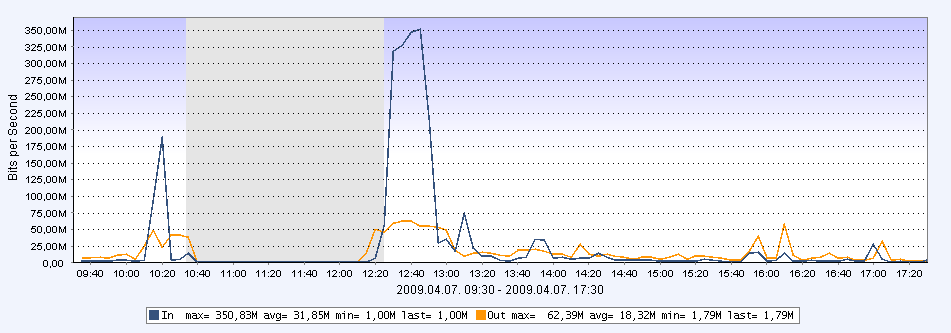
Figure 96. Image chart
If the user places the mouse pointer over the value area then the software shows the current time according to the position of the pointer. If the chart was not drawn at the bottom of the hierarchy (for example the user is viewing the charts for an equipment) then by clicking on it the user can navigate downward in the hierarchy. If the chart was drawn at the bottom of the hierarchy (for example the user is viewing an interface measurement) then by clicking on the value area or the area left and right to it the user can change the displayed time period (as if he would zoom on a JavaScript chart with reloading the chart data).