| Previous | 6.8 Report configuration | Next |
|---|
6.8.4 Creating report from on-demand report
The Report views menu can be used to create new report views, among others from on-demand reports. To do this the create_from_on_demand link must be used in the heading row.
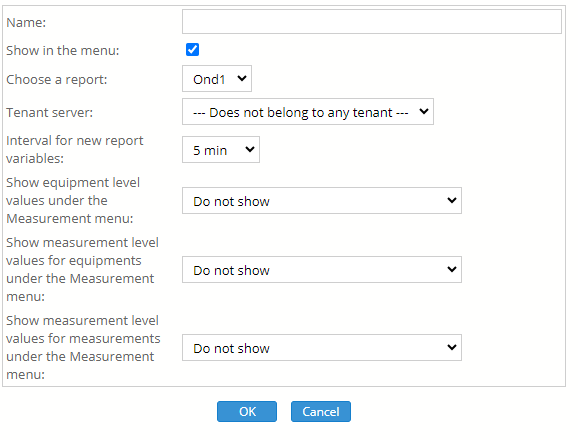
Figure 67. Report view creation using an on-demand report
The report view needs a name, which must be unique among the pre-defined reports. The “Show in the menu” governs whether the report will be available under the Reports menu or not. The user must choose an on-demand report for template, but he can only choose one of his own on-demand reports.
During the view creation PVSR checks for available report variables, but even if it finds one it allows creating a new one. If a new report variable is created then PVSR uses the interval specified here. One report variable is able to evaluate several measurements with different measurement intervals. In order to perform this, an interval must be given for the report variables as well; this will be the basis to which the application converts all measurement results during the evaluation. This conversation also means that if for example measurements below an equipment have a collection cycle of one minute and the interval here is five minutes then the maximum value shown in the reports for the equipment will be the maximum of the five minute averages, rather than the maximum of the one minute values. It is important to note that the interval cannot be modified later.
There are also three parameters which govern whether the report is allowed to appear in the Measurements menu. This can be set separately for:
· Equipment level report data when viewing an equipment
· Measurement level report data when viewing an equipment, for example viewing the interfaces of an SNMP equipment when viewing that equipment
· Measurement level report data when viewing a measurement
For each case the user can choose not to display any data, to display only the real-time or only the historical data, to display always the real-time or only the historical data or to display data according to the selected time span (real-time or historical).
After clicking on the OK button the application shows the columns from the on-demand report. For each column the user can choose an already existing report variable or he can choose to create a new one. When PVSR shows an on-demand report then it automatically determines how to format the values, but in the case of the pre-defined reports this must be manually specified. So for each column he must determine whether to show the values as they are (Is null option), or to divide them by 1 000 000 (K), 1 000 000 (M) or 1 000 000 000 (G). He can also specify the number of digits to be shown after the coma.
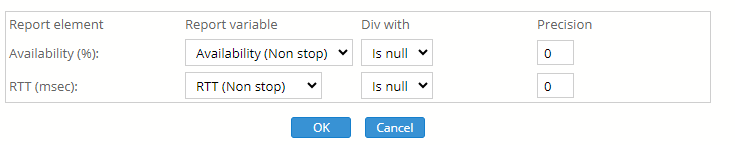
Figure 68. Report view creation using an on-demand report
After clicking on the OK button the view and the necessary report variables are created. It is important to mention that if a new report variable is created then it is done in a way that it will aggregate every measurements, ignoring any search criteria set for the on-demand report.