| Previous | 6.8 Report configuration | Next |
|---|
6.8.5 Report views
Report views have three types: Table, TopN and Chart. The first two ones are (except for a couple of small differences) almost the same: table-arranged report variables and objects (sites, equipment and measurements as well as thresholds), the third type displays the selected variables in a chart form. It is important to note that the Chart report views are not available for irregular measurements. The first step of the administration of the report views is the creation – modification – deletion of the report view. The report view parameters are the following:
· Name: The name of the report view. It appears on the top of the report page, in the Excel exports and in the menu, too (if it is a top level report – see below)
· Type: One of the aforementioned types
· Bar type: Only applicable for Table and TopN chart types. It determines the initial value shown on the Report page for this report view. The valid values are:
o Table only: the application won't have any bar presentation
o Grouped: the application will group together the so called subcolumns belonging to the same column (see the tabular report view element configuration)
o Separated: the application will not group together the subcolumns
o Order by: the application will group together the subcolumns except for the column used for sorting the table, this will remain alone
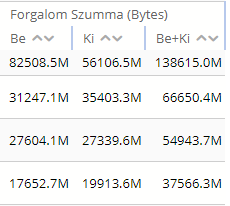
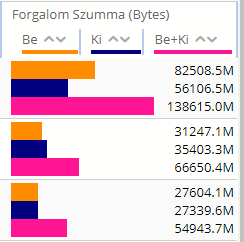
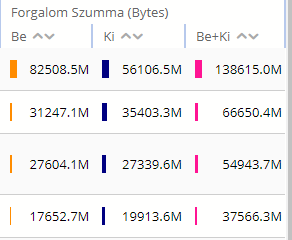
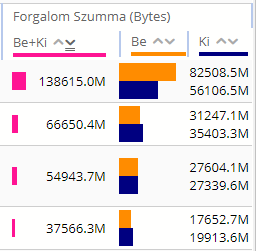
Figure 69. Report view Bar types in the same order as above
· Show date columns: Whether to show the columns like "When was the minimum" and "When was the maximum". Similar to the Bar type, this is only the initial value for the report view, the user can set it dynamically when viewing the report.
· Show in the menu: If it is a top level report, then it also appears in the left menu; if not, then it is possible that it can only be reached from another report through linking between reports. Though each report can also be of top level, it is advisable to keep their quantity below a comfortable amount to be user friendly
· First hierarchy level: The reports provide the opportunity for hierarchical navigation, and not only movements among each other or in time, so navigation is possible among sites, equipments and measurements. This settings determines the starting navigation level:
o Sites: Navigation happens similarly to the case of e.g. current measurement results or configuration view, by taking into account the additional queries at the selected variables (since only that determined structure is valid for the report).
o Equipments: Navigation always searches for all equipments under the current (for top level report it is the root) site and displays them
o Measurements: Navigation always searches for all measurements under the current (for top level report it is the root) site and displays them
o Threshold: Navigation always searches for all thresholds under the current (for top level report it is the root) site and displays them
The recommended and permissible values are different for the different reports:
o Table: Even though each value can be used, the Site starting level is typical
o TopN: Even though each value can be used, the Equipment, Measurements or Threshold starting levels are common, since the difference between TopN and Table reports is that it is not possible to navigate among the sites in the case of TopN
o Chart: Only Site and Equipment levels are permitted (since only they store detailed hierarchical evaluations), and the Site level is the typical one
· Result window: Each report – even chart type – may contain several so-called tables, and each table may contain the maximum number of objects specified here.
There are also three parameters which govern whether the report is allowed to appear in the Measurements menu. This can be set separately for:
· Equipment level report data when viewing an equipment
· Measurement level report data when viewing an equipment, for example viewing the interfaces of an SNMP equipment when viewing that equipment
· Measurement level report data when viewing a measurement
For each case the user can choose not to display any data, to display only the real-time or only the historical data, to display always the real-time or only the historical data or to display data according to the selected time span (real-time or historical).
There are three ways to create a report:
· By clicking on the [add new] link we can give each parameter then we can add the report variables to the tables one by one after creation
· By clicking on the [copy from] link we can give a report view name and another existing report. In this case all the settings of the given report (type, report variables, order, etc.) will be copied to the new report
· By clicking on the [crete from on-demand]: see section 6.8.4
After creating the report view the tables belonging to the individual hierarchy levels can be edited by clicking on the tables link. Reports can be broken down into tables in all cases, and each table is independent from the others in a sense that separate variables, object characteristics and orderings can be set for them. For example, in the case of a Table type report we can choose to display as many report variable values as possible in one table. This, however, after a certain quantity may render the report view incomprehensible, mainly if the created table does not fit in a single page. In this case we can choose to divide the variables, for example into two parts and display them so. In this case, of course the ordering aspect used at one (for example, descending order by the maximum value of a variable) will not be applied to the other table, so for example, we cannot look at the traffic data of equipments available with the highest delay time. In the case of chart-type reports the difference is in the order of the displayed charts, since this is as follows: table – object – variable(pair), so if the two different variable pairs are in the same table, then for a single object the charts will be under each other, otherwise not.
These tables should be created for each desired hierarchy level since neither the variables on the various hierarchy levels, nor the number of tables, nor the selected object characteristics, nor the selected orderings are related to each other. In the case of viewing a given report not only the tables belonging to one hierarchy level may be displayed since sites and equipment can be under a site, too, and interfaces and other measurements may be under the equipment, too; each of them is a separate hierarchy level from the point of view of the reports.
There is also an option to copy the definition of an entire level from one report to another. To use this one must click on the copy_level_from link, choose the name of the source report and the level to be copied. After the copying the destination report looks exactly the same for that level as the source report, i.e. the definition for that level is overwritten with the definition in the source report.
In the case of both Table-TopN and Chart type reports the configuration page is of similar structure, the differences are the quantity of editable fields and the ordering principles that can be selected.
6.8.5.1 Table and TopN reports
The configuration page can be divided into three parts, as it is indicated in the following figure by red:
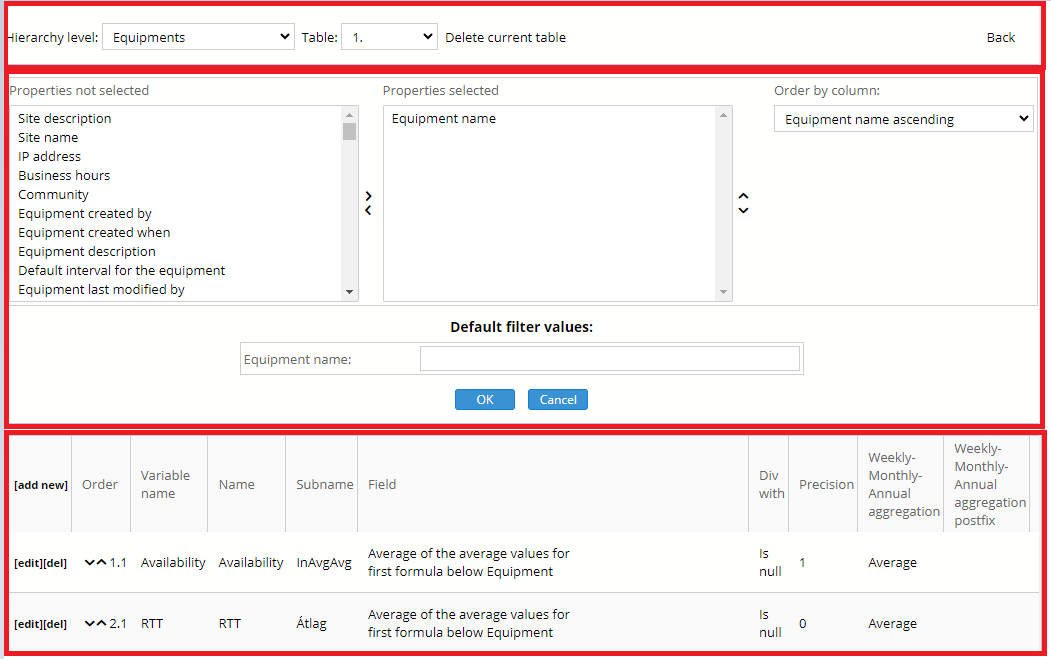
Figure 70. Report view configuration
The first part displays the current configured hierarchy level and table. One can delete with the help of the “delete current table” link, and one can create by the new table entry of the scroll down menu, the Back link leads back to the first page.
The attributes displayed in the report, the ordering principle of the objects and the default filters to be used can be found in the second part. It is important to note that the default filtering can be changed on the Report pages but not on the Measurement pages! By selecting even more than one out of the attributes they can be moved between the displayed and non-displayed ones with the help of the two arrows. The order of the displayed attributes can be modified by selecting one and changing its place with the up and down arrows. The same attributes must be in all the tables of the same hierarchy level, so no modification is possible at table level. The selected attributes might affect the report generation in other ways than just the displayed parameters:
· Multiple instances of the same equipment: if the hierarchy level is “Equipment” and the “First hierarchy level” of the report is also set to equipment and an equipment was moved from one site to another and a site attribute is also selected to be displayed then the equipment is shown in multiple rows, one for each of the sites which were its parent during the selected time period. However if no site attribute is selected then the equipment is shown in only one row
· Grouping of measurements together: if the hierarchy level is “Additional measurements” and the table contains report variables based on different measurement types then by default PVSR shows one measurement per row and the columns which are not of the appropriate type have no values:
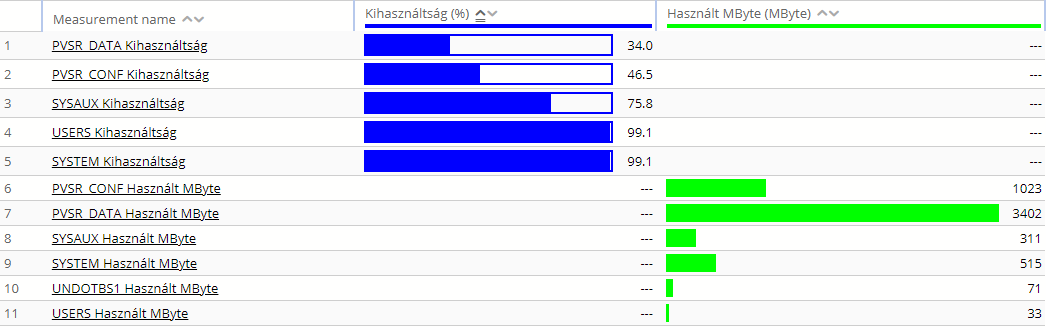
Figure 71. Report with one measurement per row
In this case clearly the two PVSR_CONF… and PVSR_DATA… measurements could be grouped together, since both show values for the same object (an Oracle tablespace in this case), only one of them is the size of the object while the other is the free space in it. In this case PVSR can group the measurements together if all of the followings are true: for all the measurement types the Table parameter is set to Yes (i.e. multiple instances on one equipment) and the “Description OID” is set to the same value (this is used to discover the object names, in this case the tablespace name), the measurement name is not selected to be displayed but either the measurement description or the index or both are selected. For example:
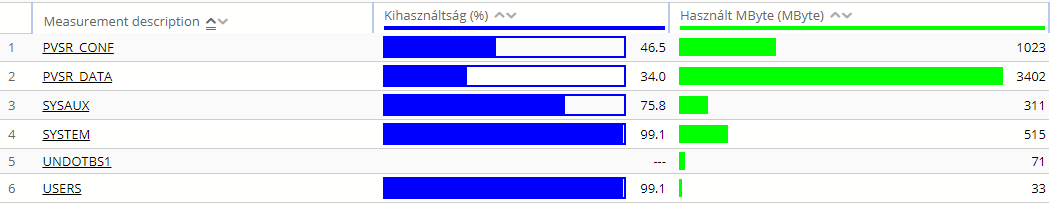
Figure 72. Report with measurements grouped together
The value in the ordering column means only the default ordering in the case of both Table and TopN reports, and it can be modified during the view of the report. The available columns here are the selected characteristics plus the values of the selected reports variables, except for the time valued ones (see below). The modifications can be finalized by clicking on the OK button.
The third part contains the variable values of the selected report. The variables are displayed according to the order within a table. As it can be seen, the order and the column name consist of two parts. In the case of Table and TopN report this is necessary since several values (e.g. minimum, maximum…) can be displayed for a single report variable, and if desired, then these are collected by the application in the heading of the displayed table, as it is shown on following figure:

Figure 73. Sample report table heading
The Alarms column is divided into three parts in the figure: percentage, Count and Sum, according to the configuration. The meaning of the individual fields seen at the configuration is the following (the list of the editable fields depends on the report type, the following list contain all possible fields):
· Links: They serve for modifying and creating the individual values
· Order: The abovementioned order in X.Y form, where X is the order of the main column, and Y is the order of the subcolumn within the main column. The order can be modified by the arrows next to the numbers:
o If the value of Y is 1, i.e. we use the arrows at the first subcolumn within the main column, then the order of the main column is controlled
o In other cases the order of the subcolumn is controlled within the main column
· Variable name: The name of the report variable. In the case of traffic type variables the chart report – similarly to the normal chart – displays the values in bits/sec, but the table reports use bytes/sec. In this latter case the conversion to bits/sec can be performed with the help of the “Div with” field
· Name: The name of the main column
· Subname: The name of the subcolumn; it is only visible on the report, if there are at least two columns
· Field: The description of the selected report variable value. The possible values depends on three things: the type of the object, the type of the report variable and whether it is based on a periodic measurement or on an irregular measurement:
o Measurement type report variable: the list shows the available options for periodic measurements, for irregular measurements only some of them are available
§ Site-equipment: All possible combinations of hierarchical and time minimum-maximum-average-sum-integral (the integral is the value of the sum multiplied by the length of the interval, for example only this can be interpreted for traffic, the ordinary sum not) that can be found for both measurement values accordant to the report variable. For the average of the averages there are two ways: either the average of the averages, or the entire daily sum divided by the entire number of measurements. Besides these, the minimum, maximum, average and sum of the successful measurements can be generated, too. There is an additional option for each time-valued minimum and maximum: the time within the period (day-week-month-year) when it was first experienced. These time-typed values can only be used if the minimum-maximum values belonging to it have already been selected
§ Interface-other measurement: Time-type minimum-maximum-average-sum-integral that can be found for both measurement values accordant to the report variable. There is an additional option for each time-typed minimum and maximum: the time within the period (day-week-month-year) when it was first experienced. These time-typed values can only be used if the minimum-maximum values belonging to them have already been selected
o Threshold type report variable:
§ Site-equipment: There are three options. For the total number of threshold violations the system returns the number of all threshold violations within the given time period. Naturally, if the threshold contains two or more variables, then its value will be increased by only one per violations. The other two options mean, for the same variable, the percentage with respect to time and the number of violations: the number of occurrences when it indicated a violation for any of the thresholds
§ Threshold: The number of and the time based percentage of violations can be selected
· Div with: If it is filled – it cannot be filled for time as well as it will not be taken into account – then the value to be displayed will be divided by this amount. The field is a dropdown list with the Kilo, Mega and Giga values (they are powers of 10 and not 2!). Since the SNMP interface traffic type variables are in bytes/sec for tables (instead in bits / sec as can be seen on the measurement charts), and there can be other bits/sec type variables too, so the K-M-G measuring units and the division by one are also displayed with the bytes/sec -> bits/sec and backward conversions, too. Accordingly, if, for example, we want to display the amount of download during a given time interval in Gbyte, then the integral type summary of the interface traffic variable should be selected and the G value as the divider. But if we want to display the maximum of the traffic of the interfaces in Kbit/sec, then we should select the maximum type summary and the K bytes/sec -> bits/sec value as the divider. In the case of conversion the application also converts the measuring unit in the name automatically in the display of the report, if it was originally bits/sec, Bits per second, bytes/sec, or Bytes per second.
· Precision: The precision of numbers, 0 by default
· Weekly-monthly-yearly summary: The evaluation period specified at the report variable regulates only the daily evaluation, beside that, there can be any other weekly-monthly-yearly evaluation, too. If the selected field is an average then there are two possible averages to be selected here:
- Average: average of the measurements for the selected time period
- Average of daily values
For example if the selected time period is a week and from Monday to Saturday the value was 10 but on Sunday it was 20 but only for half of the time was the measurement successful on Sunday then the average will be (6*10+20)/(6*1+0.5) while the average of daily values will be (6*10+20)/(6*1+1)
· Weekly-monthly-yearly summary postfix: The application appends this text to the name of the column if the field is specified and it is not a daily report. Its use is recommended only if the daily and the other timely evaluations are different.
· Column link: To which other report should the column heading of the displayed table point. In such case, the linked report will be created for the currently displayed site or equipment. So if, for example, a TopN report is linked to here, where the starting hierarchy level is Equipment, then we can view that TopN report not only for the root site but also to any of the sites if we navigate there first.
· Cell link: Similar to the previous one, with the difference that it applies to cells and not to the heading, so it is interpreted on the object in the line and not on the currently displayed one; and further navigation is not possible if the link points to a Chart.
· Over: If the table is sorted by this column, then it contains the value that should be exceeded in order to display an object. If there is no value for a given object, then it counts as -1 when sorting.
· Below: If the table is sorted by this column, then it contains the value that should not be exceeded in order to display an object. If there is no value for a given object, then it counts as -1 when sorting.
· Description: The tooltip to be displayed if the mouse is moved above the column heading
The program facilitates the creation and editing of individual variables by certain automatisms:
· If we modify the variable, and the value of the Name field is the same as the variable name, then it is also being modified
· In the course of the creation the main order should be determined. If we specify an existing order, then naturally a new subelement will be added to it, so both the Variable name and the Name are set automatically.
· If we modify the value of the field, and the value of the subname is the original value, then it is automatically modified
· If we modify the value of the field, and the value of the description is the same, then it is automatically modified, too
6.8.5.2 Chart reports
Chart reports are modified in a page with the same structure as before, with the following limitations:
· The following fields cannot be specified: Div with, Precision, Weekly-monthly-yearly summary, Weekly-monthly-yearly summary postfix, Column link, Cell link, Over, Below
· It is not possible to select time type fields
· At most two subcolumns can exist under a main column
· Sorting can only be performed by object characteristics