| Previous | 10 Viewing Alarms | Next |
|---|
10.1 Overall view
The PVSR user interface places special attention on the quick accessibility of alarms. Therefore, the alarms are displayed on the most prominent parts of the user interface and the application can also play a sound notification when a new alarm occurs (4.3 Preferences chapter). The color-coded summary of the currently active alarms are displayed on the top of the window. The user can configure this summary, see the chapter 4.3 Preferences. The alarms can be navigated by selecting the Alarms menu:

Figure 97. Alarms in the top right corner of the window
Any site, virtual site, equipment, virtual equipment can be “saved” as a submenu under the Alarms menu (Settings=>Customization=>Menu items), further speeding up the navigation. By default, only the “Root” highest level group is listed here as a submenu.
The active alarms can always be listed with a single click on the alarm summary on the top of the window. Clicking on a severity counter also immediately filters the alarms with that severity value. By normal “alarms” we mean those thresholds whose conditions are currently not satisfied.
The list view of alarms is displayed on the following figure:
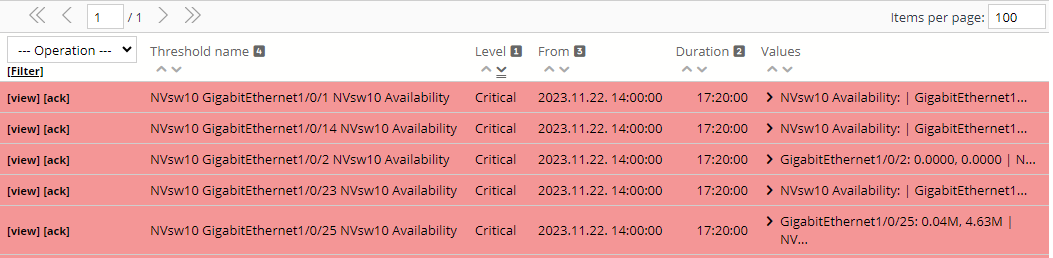
Figure 98. Table view of alarms
Note, that non-administrators can view only those alarms / pieces of equipment / sites for which they have permissions. The table has various columns but not all of them might be displayed:
· The Values column is only displayed if real-time mode is selected
· A column is only displayed if it contains meaningful data. For example if neither of the alarms is acknowledged then the Ack user and Ack time columns are missing, or if all of the entries are threshold violations then the Event column is missing
The displayed page of entries can be turned with the help of the arrows on the first line. The header is displayed under this area, which is also used to sort the list. The column and the ascending/descending order used for sorting are selected by clicking on the desired column header and the entries can be filtered with the [Filter] link.
The alarm can be acknowledged by clicking on the [ack] link – if the alarm has already been acknowledged, then the time of and the user making the acknowledgement are displayed in the table. After clicking on the [ack] link the user has three options: cancel the acknowledgement, acknowledge the alarm with a comment or acknowledge the alarm without any comment. This third option is only available if there is no system configured minimum required comment length, otherwise a comment with at least the specified length must be filled in before the alarm can be acknowledged. This comment can be viewed on the detail page of the alarm, where additional comments can also be added to the alarm. An optional automatic unacknowledge time can be set as well: after this the system automatically removes the acknowledgement. Users can also manually unacknowledge an acknowledged alarm.
If the alarm does not come from a threshold but from an event definition (SNMP Trap or Syslog), and the event has not been closed yet, a [del] link appears too with the help of which the event can be closed. (This is necessary, for example, if there is no closing event in the definition or a trap has been lost, or the alarm is not interesting for us anymore.) In this case, if the alarm has not been acknowledged yet, then it becomes acknowledged as well and similar to the acknowledgement process the user has the same three options here as well (cancel, acknowledgement with or without a comment). If the event definition has a command or an e-mail notification set then the application will run the command and send the e-mail.
The user can choose several bulk operation from the Operation drop down list in the header of the alarm table:
· Resetting the ordering
· The table can be downloaded by using the view xls entry (see subsection 10.2.6).
· Alarms can be bulk acknowledged, unacknowledged, deleted and commented. After the bulk mode is selected the user can select the alarms one-by-one or select/deselect all of them using the checkbox in the table header. Once the selection is made the user must click on link in the table header to do the operation for the alarms which are selected using the checkboxes and which are also currently visible. So for example if the user selects every alarm and the changes the filtering so only some of them are displayed and clicks on the link then only these will be processed.
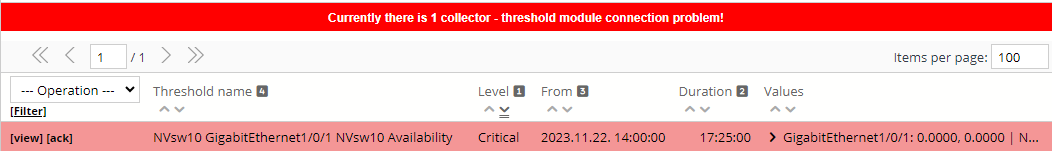
If there are connection error problems between data collectors and threshold processing servers or some of the threshold servers are not running or are falling behind with the data processing then some thresholds might not have their correct alarm statuses. To notify the users the application shows these errors on the top of the alarm pages. If a user has access to the ROOT site then the exact errors can be viewed by placing the cursor over the error message:
More detailed information can be obtained of the entries by clicking on the [view] link next to them (see next figure). The application can deduplicate individual alarms, meaning that if an alarm is raised and cleared and then re-raised again (within a specified time frame) then PVSR reopens that alarm. In such a case the detailed alarm page also shows the actual real time intervals when the alarm was raised.
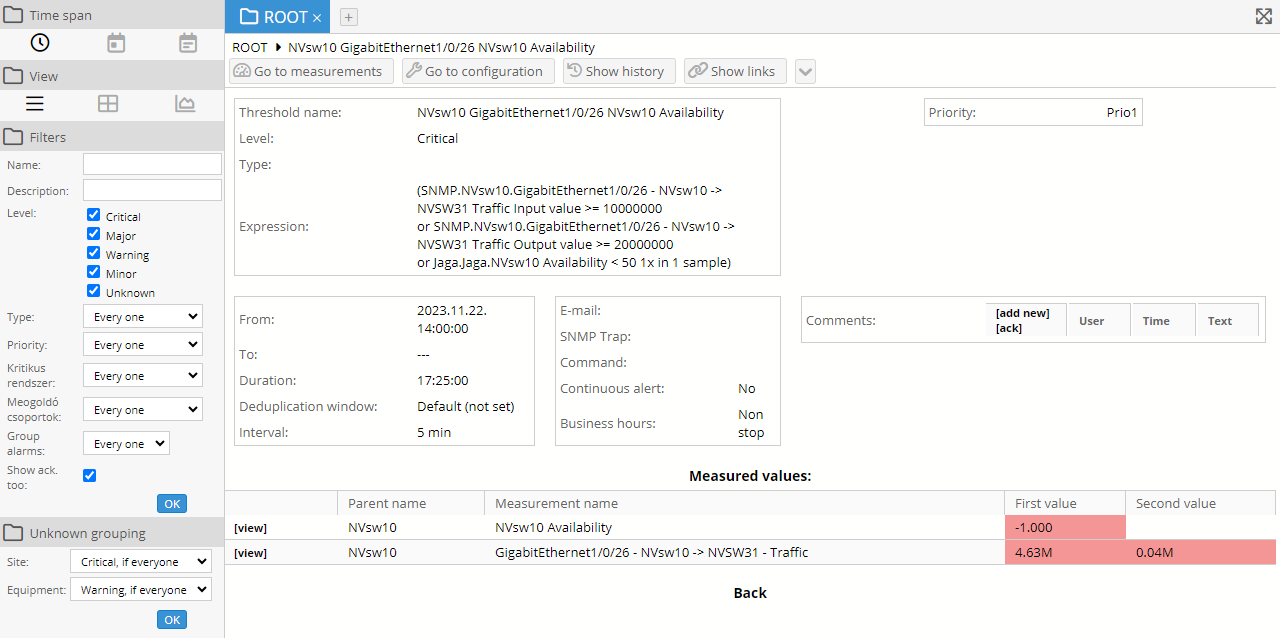
Figure 99. Detailed alarm information
By clicking on the [view] link on the detailed information page of alarms, the corresponding measurement values can be displayed in a chart (see 10.2.4). As mentioned in section 3.4 Using the display tabs, the user can also use the right and middle (wheel) mouse buttons and the Ctrl + left mouse button combination on this [view] link.