| Previous | 12 Viewing Reports | Next |
|---|
12.4 On-demand reports
PVSR has to main report types: the pre-configured reports and the on-demand reports. While in the case of the pre-configured reports the application aggregates the measurements constantly, for the on-demand reports the data is calculated only when someone views the report. The advantage of the pre-configured reports is that it doesn’t take much time to calculate it, even for many objects and for a long time period, and the application can generate and send these reports automatically via e-mail. The advantage of the on-demand reports is that anyone can create any type of aggregation for any subset of objects and for any time period and also only the on-demand reports support the time zone feature and the per equipment business hours feature. Since the application does the aggregation only when someone is viewing the report the report presentation takes much longer, but on the other hand it does not take up any space in the database and any time period can be chosen, while in case of a pre-configured report the oldest possible time is the date when the report variable was created. This section deals with the on-demand reports.
12.4.1 On-demand report types
The on-demand report is always tabular report, which can show the aggregations in three different ways:
- Equipment level: each row in the table represents one equipment
- Measurement level: each row in the table represents one measurement
- Measurement with grouping: this type is a mixture of the two other types: the application creates measurement groups by grouping measurement together based on their attributes and shows one group per row. For example: if the equipment is an Oracle database and there are free space and usage measurements for a tablespace then choosing this option and the two measurement types the result table will have tablespaces in its rows and the two measurement aggregation values in its columns
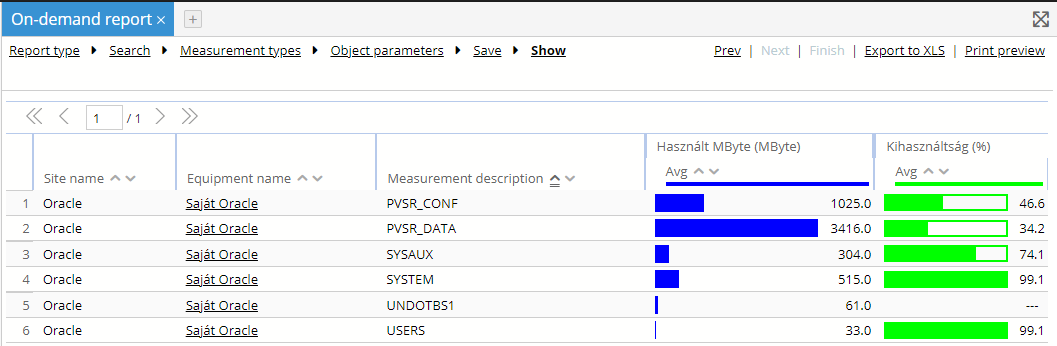
Figure 118. On-demand report with measurement groups
12.4.2 On-demand report settings
The configuration of an on-demand report has maximum five steps, which are the followings:
- Choosing the report type, the business hours (for example aggregate the measurements only during working hours), the bar type and the result window
- Choosing the objects (equipments and/or measurements)
- Choosing the measurement types and their aggregations
- Choosing the object parameters to be shown
- Saving the report configuration for later use
Each configuration step as well the actual report generation can be accessed via the links on the top of the page. The application enforces the dependencies between the different steps and it ensures that the user cannot switch to a step unless all of its prerequisites are meet. There are different ways to navigate between the steps: their names serve as links, but the Prev and Next links can also be used. The Finish link is equivalent to the last step (Show) and the last link can be used to export the result into an Excel file.
The example screenshots below will reproduce the same output as can be seen on the previous figure.
12.4.2.1 Report type, business hours, bar type and result window
Four things must be set in this step: the type of the equipment (see 12.4.1), the business hours for the report, the bar type to be used and the maximum number of result rows displayed on the UI. The business hours specifies the time periods when the aggregation should not occur, for example one might choose to aggregate the values only during working hours or the user can also choose to use the business hours set separately for each equipment. The drop-down list contains the business hours defined in the Settings -> Templates menu. The bar type has the following valid values:
- Table only: the application won't have any bar presentation
- Grouped: the application will group together the so called subcolumns belonging to the same column (see the tabular report view element configuration)
- Separated: the application will not group together the subcolumns
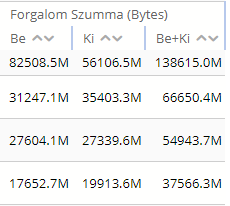
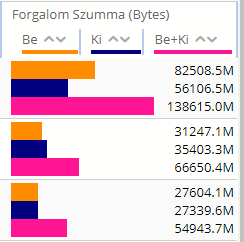
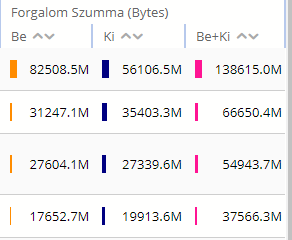
Figure 119. On-demand report bar types in the same order as above
If we have not choosen the Table only option and the unit of the measurement begins with the percentage sign (%) and the values are less than or equal to 100 then the application shows them compared to 100:
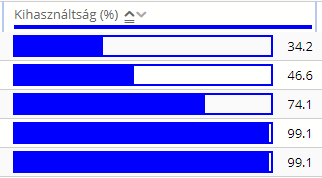
Figure 120. Percentage bar presentation
The page shown in the first step is the following:
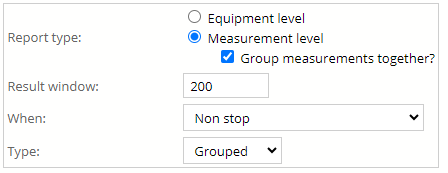
Figure 121. On-demand report type
12.4.2.2 Objects
The second step is the choosing of the objects shown in the report. This step is very similar to the Search menus (see “Searching”), there are only two differences:
- Only equipments and measurements can be searched for
- The result page contains checkboxes instead of links. With these checkboxes the user can select only those objects which he wants to appear in the report
The type of the report and the type of the object the user can search for are not related to each other. For example the user might choose a measurement report and search for equipments, in which case he will see every measurement belonging to that equipment. He can choose to search for measurements, in which case he will be able to manually select the measurements he want to be shown in the report.
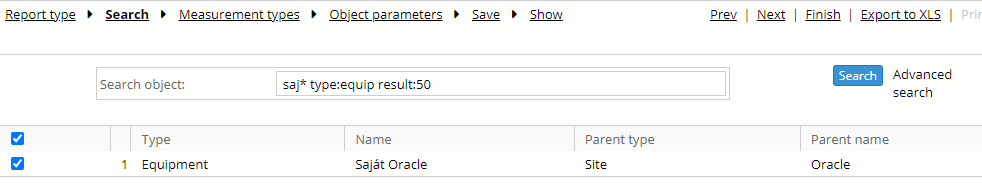
Figure 122. On-demand report objects
As shown on the figure above, the report won’t contain the measurements from the equipment called “Chivas Oracle”.
12.4.2.3 Measurement types
The next step is to choose between the measurement types found in the previous step, to choose the aggregation method and to choose whether both first and second measurement values (for example input and output traffic) or only the first (for example input traffic) or only the second value should be displayed. The aggregation can be done along the hierarchy and along time, although the hierarchy based aggregation is only valid for equipment reports. The setting of the aggregation can be done in three different ways:
- Uniformly for every measurement type. In this case the user can select minimum, average, maximum, sum and integral. The aggregation along the hierarchy and the time line is the same in this case, so for example by choosing the minimum the application will calculate the minimum value for an equipment in every measurement cycle and then calculate the minimum among these values. The integral aggregation is similar to the sum aggregation except that the application multiplies the values with the measurement interval, so for example the integral of interface measurements will be in Bytes rather than Bits Per Second
- Per measurement type. This is the same as above except that the user can specify different aggregations for the different measurement types
- Advanced settings. In this case the aggregation along the hierarchy and the aggregation along the time can be set separately. Since the later aggregation makes only sense for equipment reports, this mode cannot be chosen for the other two types
Since the user can switch between the steps, there is the possibility that he first chooses some objects then he chooses a measurement type and changes the selected objects in a way that none of them will have measurements of the selected type. In this case the application will still show the previously selected measurement type but with red letters, indicating that it won’t be shown in the report.
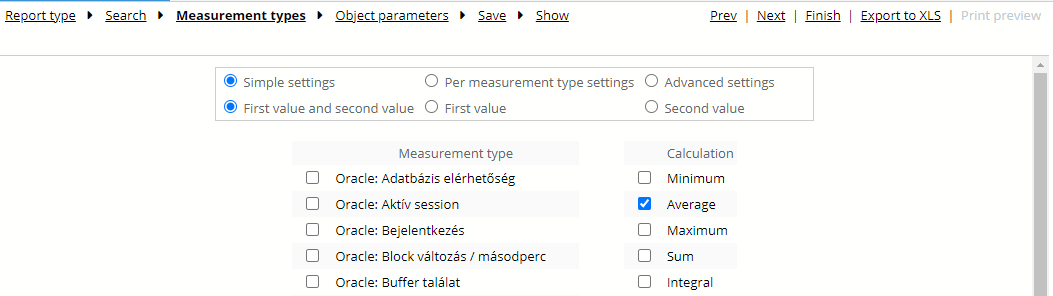
Figure 123. On-demand report measurement types
12.4.2.4 Object parameters
The object parameters to be shown in the report can be chosen here. The options include standard parameters (like the name of the site or the equipment) and user defined attributes as well: PVSR lists every user defined attributes suitable for the selected equipment types.
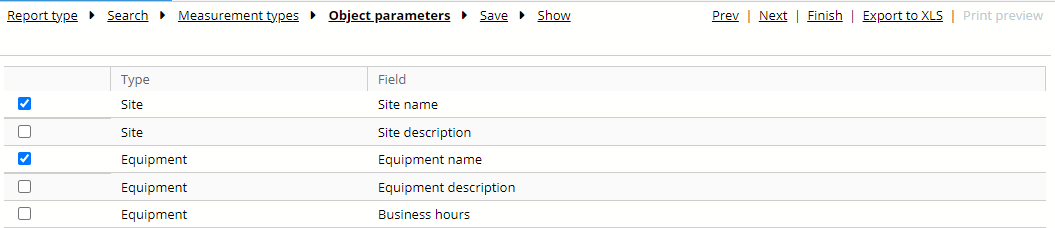
Figure 124. On-demand report object parameters
12.4.2.5 Save
The user has the possibility to save the report configuration. Since this is an on-demand report this does not mean that the calculated data will be saved, only the definition of the report itself. The application saves the configuration if the user specifies a name and switches to the last step (showing the report) or click on the OK button. These saved report definitions appear as submenus for the Reports menu, only visible to the user how had created them. There are two ways to delete such a report definition: the user either has to delete the name and click on the OK button or he has to click on the Delete button. If the report definition was saved previously and the user changes its name then the application has two ways to handle this: if the “New template” checkbox is checked then it saves the definition as a new one, but if it is unchecked then it will update the name of the report definition.
The application does not save the selected objects in the second step and it only saves the search expression if the corresponding checkbox is checked.
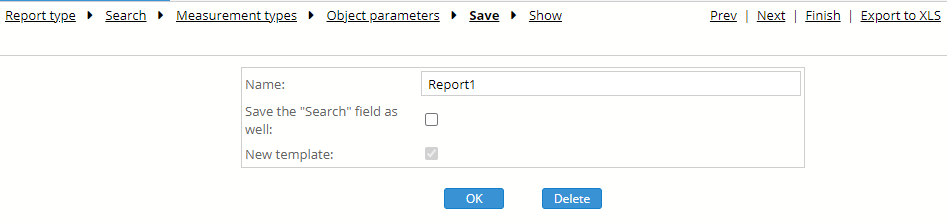
Figure 125. On-demand report saving
12.4.3 Viewing the on-demand reports
After the configuration is done the report can be generated. If the user previously had chosen to save the report configuration then on the next time the only required configuration is the choosing of the objects for the report. In this case the application immediately shows the second step and after the searching is done the user already can switch to the report viewing with the help of the Show or the Finish link.
The report generation can take a long time, since the aggregation is only done when someone views the report. Because of this the application displays a different “Please wait” message for the on-demand reports. It shows the percentage done and it refreshes this information periodically. After the first refresh it also shows a button which allows the canceling of the report generation. It is important to notice that if the calculation needs to be canceled then this button must be used, because closing the browser application on the client side will not terminate the calculation on the server side.
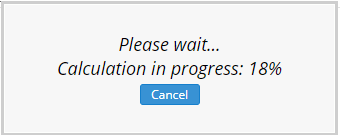
Figure 126. On-demand report percentage done
The application offers the possibility to save the result of the report immediately into an Excel file without showing the results first on the GUI. However this functionality is not recommended: if the user chooses to export the data without first selecting the last step (viewing the report) then the server will start to generate the report but the user will not have the possibility to cancel the operation. However if the user first generate the report and then export it into Excel then the export will be done using cache files on the server side so it doesn’t take more time to first generate the report and then export it than export it immediately.
The time period for the report can be changed during each step with the help of the calendar on the Browser area. The time zone can be also specified here, if there is at least one time zone configured in the system. If the user is in the last step then the application will regenerate the report data.
The report result table can be reordered by any column like the pre-configured reports, but unlike the pre-configured reports this is done entirely on the client side, i.e. the application does not have to regenerate the report data. The user can open the result page in a new browser popup window by clicking on the Print preview link.
The users can click on the result elements with the left mouse but as mentioned in section 3.4 Using the display tabs, the user can also use the right and middle (wheel) mouse buttons and the Ctrl + left mouse button combination on the result links. Since using the left mouse button means that the user is leaving this page, and the system will have to recalculate the whole report when visiting again, it is highly recommended here to use the other opions.