| Previous | Next |
12 Viewing Reports
The application has two different report types under the Reports menu: the pre-configured reports (see Subsection 6.8) and the on-demand reports.
The Browser area contains a Calendar, which is used for setting the time interval of the report and a group called Settings which has elements both for the chart reports and the tabular reports:
- Type: bar type for the tabular reports. Only applicable for Table and TopN chart types. The valid values are:
- Table only: the application won't have any bar presentation
- Grouped: the application will group together the so called subcolumns belonging to the same column (see the tabular report view element configuration)
- Separated: the application will not group together the subcolumns
- Order by: the application will group together the subcolumns except for the column used for sorting the table, this will remain alone
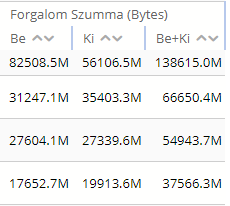
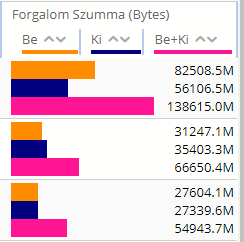
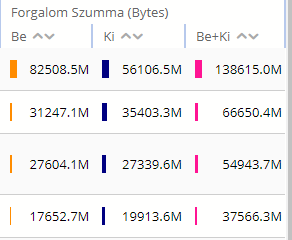
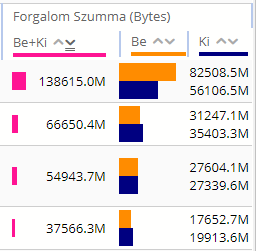
Figure 115. Report view Bar types in the same order as above
· Show date: whether to show columns like "When was the minimum" and "When was the maximum"
· Chart, Indicator and Y prefix: their usage is the same as the “Chart settings” options with the same names under Measurements and Alarms
If we have not choosen the Table only option and the unit of the measurement begins with the percentage sign (%) and the values are less than or equal to 100 then the application shows them compared to 100:
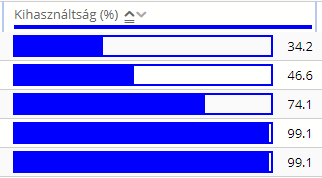
Figure 116. Percentage bar presentation
The reports are variable evaluations on the set of all basic objects (non-virtual sites, non-virtual equipments, measurements and thresholds) in the system or on certain subsets of that. For the pre-configured reports the administrators can configure the selected subset of objects, the variables and even the look of the reports, that is, the system contains only the on-demand report functionality after installation. The reports are of one of the following four kinds:
1) Pre-configured
a. Table
b. TopN
c. Chart
2) On-demand
With the exception of a few minor details the first two types are virtually the same: tables containing report variables and objects (sites, equipments and measurements). The third type displays the selected variables on charts and the fourth type represents the on-demand reports.