| Previous | 11 Viewing Measurements | Next |
|---|
11.1 Using the Measurements menu
For some part, viewing measurements happen similarly to viewing alarms: in the middle of the screen, there is a configurable quick menu, to which new elements can be inserted with the Settings=>Customization menu.
Besides this, the Browser is also available on the left side of the screen, with the help of which the user can set the desired view, navigate in the site-equipment-measurement hierarchy, and show/visualize the measurements according to the measurement type too.
Of course only those objects (site-equipment-measurement) are accessible to the user for which he or she has permissions.
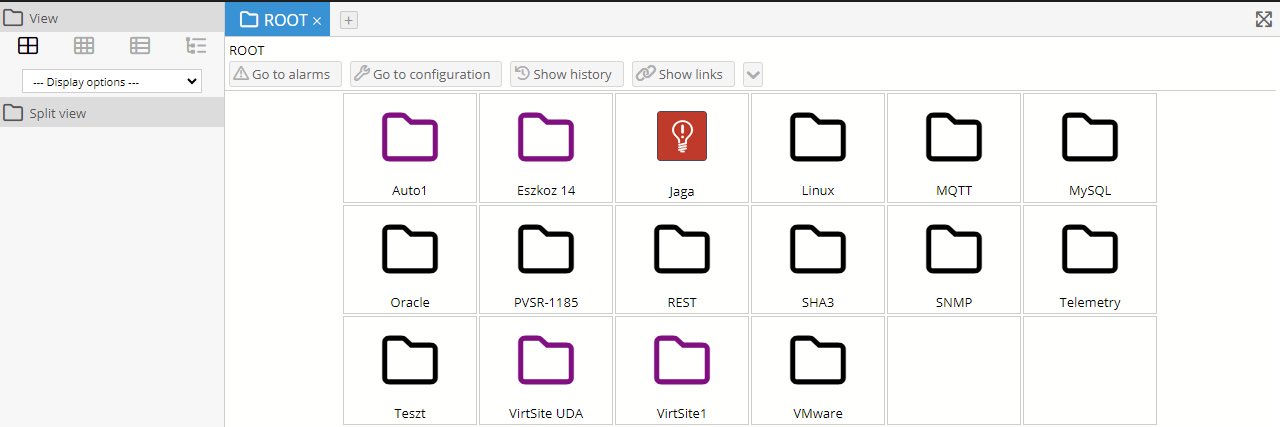
Figure 111. The Measurements main menu item with the Browser and the Icon view
The figure above shows the Browser and the Icon view of the selected hierarchy level (Root). As mentioned in section 3.4 Using the display tabs, the user can also use the right and middle (wheel) mouse buttons and the Ctrl + left mouse button combination on the name and the icon of the site/equipment.
There is one plus feature for the right mouse button click if we click on an equipment: the pop-up menu shows the different equipment display templates available for the equipment and if we change the selection before clicking on any of the “Open in…” menu element then the equipment will be immediately displayed with the selected display template.
The Timespan group is only shown when an equipment or a chart is currently shown. There are three options, similar to the Alarms menu:
· The real-time view can be selected with the first clock icon; in which case the currently active alarms are displayed in the table.
· By clicking on the second icon (“Historical view by date”) a Calendar is displayed in which the desired day-week-month-year can be selected with a couple of clicks (for the detailed usage of the Calendar, see subsection 12.1).
· The third icon (“Historical view by time”) allows the user to specify the time interval accurately with second precision.
The time zone can also be chosen here once at least one time zone is configured in the system, similarly to the Alarms menu, but there are two additional options:
· Set at equipment: the time span is interpreted in the time zone set at the equipment and the charts are also shown in that time zone. For example if we chose a day and one of the equipment is in Berlin time zone and the other in New York time zone then the X axis labels on the charts will be the same but there will be a 6 hours difference between the measurement values at the same position
· Server/equipment: the time span selection is interpreted in the server time zone but the charts are shown in the time zone set at the equipments, so in the example above the charts will have different labels on their X axis at the same position but the measurements at the same position are coming from the same time
Unlike the Alarms menu, the business hours can also be specified here. If a business hours is chosen then PVSR will not show a grey are when the measurement was not successful, but it will consider values only in the given time window. For example if the “Every day between 8am and 4pm” is chosen and the user views the chart for a whole year then he will see one or two value per day (average and maybe maximum – see the Peak setting) but the average/maximum will be calculated only using values between 8am and 4pm (according to the time zone selected).
If a chart contains values from multiple equipments and
· They have different time zones and “Set at equipment” or “Server/equipment” is selected for the time zone OR
· They have different business hours and “Set at equipment” is selected for the business hours
then PVSR will not show the chart, instead an error message is shown, indicating that the chart cannot be drawn with the current settings.
Three types of arrangements can be selected in the View group:
- Icon: (as in the figure above) the elements of the hierarchy level under the selected item are shown with a big icon and name; at most 5 items in a row. The navigation can be continued by clicking on the icon.
- List: the elements appear with a small icon and name, which makes it possible to view many objects on a small screen.
- Detailed: elements are listed under each other with a small icon, name, description and type. Navigation is also performed here by clicking on the icon.
- Tree: the different points of the tree hierarchy can be opened or closed without actually navigating to that element
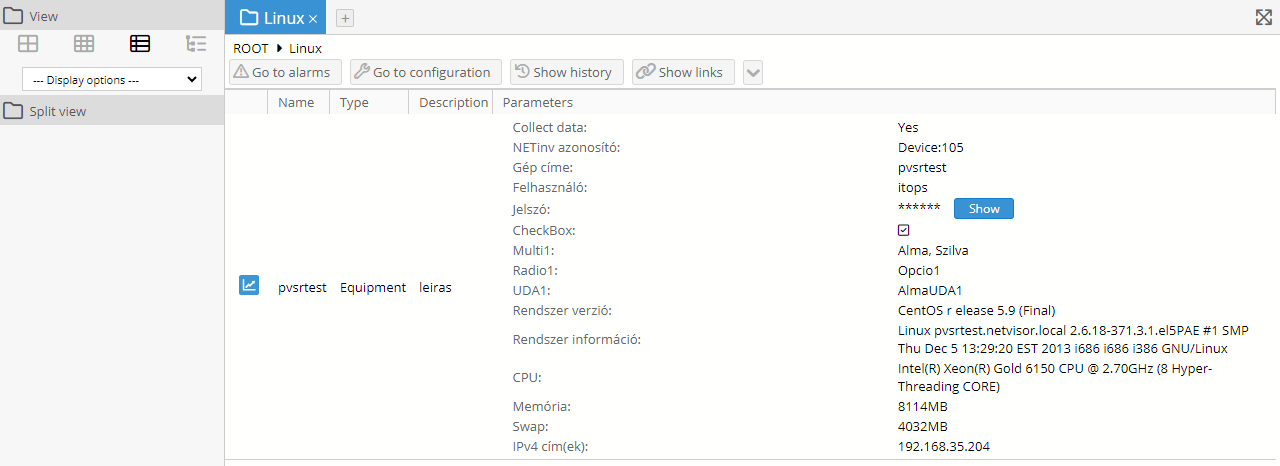
Figure 112. Navigation between measurements: detailed view
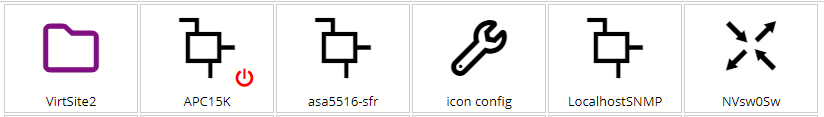
If the data collection is disabled for an equipment and we are viewing the items in Icon, List or Detailed mode then the application shows a small  icon in the bottom right corner of the equipment icon:
The next group on the Browser area is the Split view. It initially has only one element called “Select second object”. This enables the user to split the main area into two half, both of them showing a different object (site, equipment or chart). The left side shows initially the current object selected and the user can choose the object for the right side in two ways. He can search for it with a page similar to the Search menu or he can take the object from one of the open tabs. PVSR shows every tab in a drop-down list in the same order as they appear on the user interface but uses a red background if that tab cannot be chosen. Only tabs showing an object in the Measurement menu can be chosen and only if that tab isn’t already in split view mode. This means that even the current tab can be chosen in which case both sides will show the same information.
Another option for opening something in split view is to right-click on it and choose the Open in split view element. This option exists even if we are already in split-view: in this case the selected object will be opened on the other side.
There is a last option for using the split view, but this only available for charts and measurements. If we are not in split view and right-click on the name of a chart or a measurement and select the Add to split view element then the application opens a new empty split view and places the chart onto it. The user then can add additional charts onto the split view or remove any already added chart by clicking on the  icon next to its name. The user can also save this as a virtual equipment by selecting the Save as virtual equipment element from the Operation drop-down list.
Once in split view mode, the user has two setting options. He can choose between individual and common scrolling, i.e. whether the two sides should be scrollable independently of the other. The other option allows returning to the normal mode, by either keeping the object on the left side or the object on the right side. The user can also close one side of the split view by clicking on the  icon in the Hierarchy area. The main area functions in split view mode similar to the normal mode, for example the currently selected object can be changed by navigating in the hierarchy. The only difference two differences are the following: there is no Operations drop-down list and charts can only be shown in a one-column table (i.e. only the Large chart mode can be selected).
Besides the above-mentioned cases, also the Measurements=>Search menu item can also be used for displaying actual measurements, where the desired tool can be selected with an interface similar to the search window described in Subsection 6.11. After this the measurement charts can be viewed by clicking on the [view] link of the equipment.