| Previous | 6.2 Site and equipment configuration | Next |
|---|
6.2.3 Equipments
An equipment’s configuration page has multiple subtabs, displaying different parameters related to the equipment. The subtabs differ whether we are only viewing the configuration or whether we are modifying the equipment:
· Properties: the equipment’s main parameters
· Interfaces: SNMP interface measurements on the equipment
· Measurements equipment’s measurements
· Thresholds: those active thresholds which have measurement in their expression belonging to the equipment
· Disabled thresholds: those active thresholds which have measurement in their expression belonging to the equipment
· Measurements about to be deleted: those measurements during an equipment modification which are no longer present on the equipment, those they will be deleted once the modifications are saved
With the exception of the first tab all of them show the number of entries on their pages.
This section describes the following equipment configuration tasks:
· 6.2.3.2 Equipment modification
· 6.2.3.3 Viewing the equipment configuration
· 6.2.3.5 Modification of measurement intervals
· 6.2.3.6 Jaga measurement synchronization
· 6.2.3.7 Template based creation of single equipment
· 6.2.3.8 Custom relationship configuration
· 6.2.3.9 Data collection log and time stats
The equipment types can be characterized in different ways:
Discovery
The data collector might support measurement discovery or it might not. In the former case PVSR will communicate with the equipment during creation / modification and in most cases the user will only have to select measurements from a list of available measurements. However sometimes even in this case the user may add additional non-discoverable measurements (for example Unix/Linux directory usage measurement). Also in some cases the data collector does not support discovery at all (for example Synthetic transaction measurements), in these cases every measurement has to be created manually
Collection cycles
A data collector either collects values periodically or it has irregular measurements. In the former case each measurement has an Interval parameter (15 seconds, 30 seconds, 1 minute, …) and PVSR does the data collection periodically, once every collection cycle. The measurement result is stored for an exact collection cycle time, i.e. a measurement with a collection cycle of 1 minute has values at 12:00:00, 12:01:00, 12:02:00, … In the irregular mode measurement values might arrive in the system at any given time, i.e. a measurement can have values at 12:00:00, 12:03:15, 14:28:33, … An example of such a collector type is the MQTT data collector, which receives messages in a queue and measurements only have values if an appropriate message arrives. Since controlling when an irregular measurement can be calculated is outside of the scope of PVSR, these measurements do not have an Interval value. Instead they have an “Expect data in” parameter which tells PVSR how often a new value is expected to arrive. PVSR uses this information only in the threshold processing module: if a measurement has a threshold and no data arrives for it in the specified time then PVSR assumes its state to be unknown and raises an Unknown level threshold if additionally the time on the “Unknown level threshold wait cycle” page has passed and still no data is received for the measurement. The following part of the documentation assumes the more common periodic data collection scenario. In every case where measurement interval is mentioned, the “Except data in” parameter must/can be specified for irregular data collector types. While the Interval parameters can only have a value from a fixed list, these parameters can have any value, so their values must be specified in term of seconds. It is also important to mention that PVSR stores the “Expect data in” parameter in the same place where the regular Interval parameter is stored, so for example when one is searching using the value of the Interval parameter, the system also searches using the “Expect data in” parameter.
6.2.3.1 Equipment creation
The first step of the equipment creation is opening those site’s configuration page which will contain the newly created equipment. If the user is currently using the simple configuration mode, then he only sees one equipment option called New equipment. Selecting this option shows first a drop-down list: if the user selects an equipment template then he will use the template based creation of a single equipment, otherwise if he selects an equipment type then the equipment creation page.
If creating equipments using a template then only the basic equipment parameters can and have to be specified (see 6.2.3.7 Template based creation of single equipment and 6.5.1 Template based creation of multiple equipment). But creating a new piece of equipment without a template needs more steps.
1. We choose the site where we want to create the equipment below and select the Create new equipment item from the pull down menu.
2. We select the type of the equipment: the same choices are listed here as for the measurement server groups. If a measurement server group can be defined for the site, then the one specified there will be selected from the list by default.
3. The following parameters have to be filled:
a. Equipment name: as opposed to the site it has to be unique not only under the parent site but in the whole system.
b. Equipment description: optional
c. Parameters depending on the measurement server type:
i. SNMP:
1. Address: IP address or name. The port can also be specified by separating it with a colon, e.g.: 127.0.0.1:161
2. Community: the SNMP password or passwords for the equipments (see below under SNMP community specification). By default public
3. SNMP version
ii. Other: further parameters defined in the database. The parameter types can be text, number, scroll down menu, checkbox, or radio button. Some parameters can be mandatory, or have a default value too. You can find their detailed description in the adequate measurement server type section of the Appendix.
d. Any number of user defined attributes: these attributes can be specified on the user interface
e. Keep non-aggregated data for days: The equipment should keep the detailed measurement results for this number of days, after then only an hourly averaged measurement value is kept. The configuration given here controls what the default value should be when adding each measurement, but the actual time of taking the average depends only on the value set for the particular measurement.
f. Default measurement interval: The default measurement period for newly created measurements.
g. Timeout and retry: This parameter is significant only for SNMP and some non-SNMP data collectors (for more details see Section 14.1 on Specifics of measurement server types). If a value is set for the equipment, then the system uses that during both the measurement and discovery. If the value is not specified, then its value is taken from the configuration file (see 13.2.1 Configuration): first, a settings is searched that matches the measurement interval set for the measurement or the default measurement interval set for the equipment to be discovered, if no such found, then the default settings is used. For example: if the timeout for the equipment is set to 15, then it is always 15 seconds. If it is not set, and the default measurement interval is 300 seconds, then during discovery the system searches first for an entry with a period of 300 seconds; or for an entry with a period of 60 seconds in the case of a 1-minute measurement interval.
h. Icon: with which icon should the equipment be displayed on the user interface
4. Time zone: the time zone for the equipment. The value set here can be used in the menus Measurements and On-demand reports
5. Business hours: the business hours for the equipment. The value set here can be used in the menus Measurements and On-demand reports
After equipment creation, the same operations can be performed as during equipment modification.
SNMP community specification
The PVSR supports the SNMPv1, SNMPv2c and the SNMPv3 protocols not only for SNMP equipments but also for measurement server types that perform their measurements using SNMP. For SNMPv1 and SNMPv2c the community simply has to be the community.
For SNMPv2c there are two additional options:
· SNMPv2c - no bulk walk: PVSR will not use GETBULK SNMP requests
· SNMPv2c - no bulk walk - no bulk get: PVSR will not use GETBULK SNMP requests and it will not query more than one OID in one GET request
For SNMPv3 the community value to be specified depends on which of the SNMPv3 possibilities we choose:
· Encryption of the authentication only: in this case the value of the Community field has to be filled out in the form of xxx/yyy, where xxx is the user name and yyy is the password used for authentication. For example: username/authpassword
· Encryption of both the authentication and the communication: in this case the value of the Community field has to be filled out in the form of xxx/yyy/zzz, where xxx is the user name, while yyy and zzz are the passwords for authentication and communication, respectively. For example: username/authpassword/privpassword
· No encryption: only the username has to be specified. In this case it doesn’t matter what kind of authentication is specified in the SNMP version parameter
In every case the context engine id and the context name can also be specified as well by putting them after the user name (xxx in the examples above). For the context id the format @CEIDcontextengineid must be used and for the context name the @CTXNAMEcontextname. If we want to use both of them then first the context name must be specified and than the context id: xxx@CTXNAMEcontextname@CEIDcontextengineid
In case of SNMPv3, the encryption algorithm can be set separately for authentication and communication. For the former it is possible to choose between MD5, SHA-1 and different SHA-2 options, while the latter one is either DES or AES128 if the communication password is set.
6.2.3.2 Equipment modification
There are several ways to modify a piece of equipment, and except for one, all can be achieved by selecting an operation from Operations list when viewing equipment configuration. The different modification operations are:
· Equipment modification: we can modify each parameter and after saving these modifications we get to the equipment configuration display page. Before starting the modification the system rediscoveries the list of measurements that can be carried out on the equipment. During the operation, the following notice appears on the page (it disappears after finishing the operation):

· Equipment modification from the site: when viewing sites there is an [edit] link in the equipment lines which can be used to get to the same page as in the previous item with the only difference that after the modification we get back to the site page.
· Equipment modification without discovery: during modification only the equipment parameters are modified, the measurements are not. Accordingly, the PVSR does not carry out the equipment discovery, and consequently the operation can be performed faster provided we want to modify equipment parameters only
· Activating/deactivating data collection: depending on the equipment status, only one of the two is displayed in the Operations pull down menu. The turning on and off data collection operations corresponds to the setting and clearing of the „Collect data” checkbox on equipment modification page. After turning off the data collection, the PVSR does not collect data from the equipment until the switch is turned back, but it does not delete the equipment either. Therefore, the equipment is displayed similarly to other equipment under the Measurements and Alarms menu items, and its threshold and charts definitions are also retained.
· Running an equipment template: the user can choose an equipment template and create all the measurements/thresholds based on it. The user can also choose to save this equipment template – equipment relationship, so next time PVSR will offer that template by default and he will be able to refer to that template on the Bulk measurement discovery (6.5.2) page and on the Automatic template reapply (5.9.14) page.
There are also several bulk modification options as well, for those look up the 6.5 Bulk configurations section.
If a measurement (interface or other measurement) is created for a piece of equipment, then the measurement values can be viewed immediately on the accompanying basic charts, or additional public and private charts can be created. The color, type and transparency settings of basic charts are shown in the central configuration file (see DEFAULT_CHART… parameters)
If the name of the equipment is modified then the system automatically renames the relevant charts, thresholds and Jaga ping measurements.
6.2.3.2.1 Viewing and filtering measurement during equipment modification
During the modification of the equipment, one or two subtabs appear depending on whether the equipment is of SNMP data collector type or not: the interfaces are always displayed on the first tab, while the other non interface measurements on the second one. Both subtabs show a table which can be filtered, and in certain cases they do not display all results.
If there are too many measurements on the equipment, the equipment configuration page can become too large. This has the following two consequences: the time of downloading the page from the server to the user’s browser increases; and the browsers could face serious performance problems while displaying the page. Therefore, the PVSR does not show all results in the table for more than 1000 possible measurements. In these cases, the first line of the table has an orange background indicating that it does not display all results. We can move between the result pages by rewriting the current page number or using the forward/backward navigation icons.
Important to note: if we perform a change (for example, we turn on a measurement), then that change is not saved when moving between the pages and the system does not remember these modifications either. Example: if we turn on a measurement, move to the next page, select a measurement there, and save the equipment then only the second measurement is saved. Had we gone back to the first result page, the measurement selected there earlier would not have been selected and during the save no measurement at all would have been added.
The interface measurement table and other measurement tables can be filtered based on different fields. If a filter is turned on for the table, then similarly to paging, the top of the page becomes orange. If more measurements then the number mentioned before could be added or exist on the equipment, and the filter fields are modified, then the browser asks the server for the equipment configuration once again, and similarly to paging, the performed modifications are not saved. If there are fewer measurements, then the filtering takes place without the server-client communication, so it is faster and the modifications are saved after pressing OK even if the filtering has been changed and the modified line in question is not even visible. Example: Let there be 2000 interfaces on some equipment, and then let select one of the interfaces for the measurement and modify the filtering condition so that there will not be any hit. In this case, the interface will not be created, and even if there are no filtering hits, since 2000 interfaces exist on the equipment, the server-client communication takes place again during the filter modification. On the other hand, if there are only 200 interfaces on the equipment, the filtering does not result in server-client communication and even if we press OK after the filtering with zero hit, the interface selected before the filtering is saved.
If a measurement has been previously created in PVSR then the selection checkbox for it is checked when the page is first loaded, otherwise it is not checked. Both tables have a checkbox in their heading row: by checking it every – at the moment – visible measurement will be selected; on the other hand by unchecking it every – at the moment – visible measurement will be deselected. The heading rows also have a data collection interval drop-down list: this can be used to change the data collection cycle for all the visible measurements. The input fields for a measurement are in a non-modifiable state when the measurement is not checked and are in a modifiable state when the measurement is checked. Obviously if the measurement is not selected before saving the changes then it won’t be created in PVSR in this case either; this modified behavior serves only the purpose of a faster client response time.
6.2.3.2.2 Interface measurements
The interface table can be filtered based on two conditions:
· Interface measurement name
· Only the currently selected interface or filtering based on type and possible problems. The “Only the selected” option corresponds to those interfaces next to which the checkbox is turned on. The “Without critical errors” option filters those interfaces out that are not work according to the operational status or for which the input or the output measurement counter query was unsuccessful
For the interface table the following columns are displayed:
1. Index: By clicking on it (if it is possible) we can view the incidental error message that is determined by the program in connection with this interface. The possible sources of error:
· The interface speed is 0
· It is probable that traffic measurements cannot be performed on this interface type
· It is not possible to query the traffic counters for the interface
· Identical interface description. This can be a problem because the program during measurements continuously monitors the interface description texts and if the serial number of one of the interfaces changes then it corrects that. If the interface descriptions are identical, then the program is unable to perform this.
2. Name: This will be the name of the measurement. It has to be unique for the equipment. The system tries to name the interface based on several parameters but this value can be changed, of course:
· If it is permitted (see the USE_INTERFACE_IP_ADDRESS configuration parameter) and the interface has IP addresses, it is named after these. The application can handle IPv4 and IPv6 addresses
· If the equipment is Cisco and the OLD-CISCO-INTERFACES-MIB::locIfDescr variable is specified for the equipment, then the interface is named based on this
· In other cases, based on the standard RFC1213-MIB::ifDescr, except if the specified value occurs several times, while the IF-MIB::ifName value for a single interface only, because in this case the latter is used
3. Switched: If we check it, then the input and output values will be switched during the measurement.
4. Measurable values: (traffic/error/carrier up-down)
5. Interval: The period the measurement should be executed with.
6. Collected data: For how long should the detailed measurement values be kept for the particular measurement.
7. Peak: For which chart types should the maximum values be displayed.
8. Remark: By clicking on the [edit] button we can also specify a remark for the interface, if it has been selected for measurement. If the program did not take the interface description from the standard description table (e.g.: in the case of Cisco), then it will automatically fill in this value, too.
If not the SNMPv1 protocol is set for the equipment, then during the creation of the interface the system checks whether the 64 bit traffic counter returns any value, and if so what kind of data it returns, and based on these results it decides automatically which counter it will use to measure the traffic:
· If it does not return any value, then it uses the 32bit counter
· If it returns a value bigger than zero, then it uses the 64bit counter
· If it returns zero, then it asks the 32bit counter and if that value is also zero, then it will use the 64bit, and if it is nonzero, then the 32bit counter.
This setting will not change during any modification later.
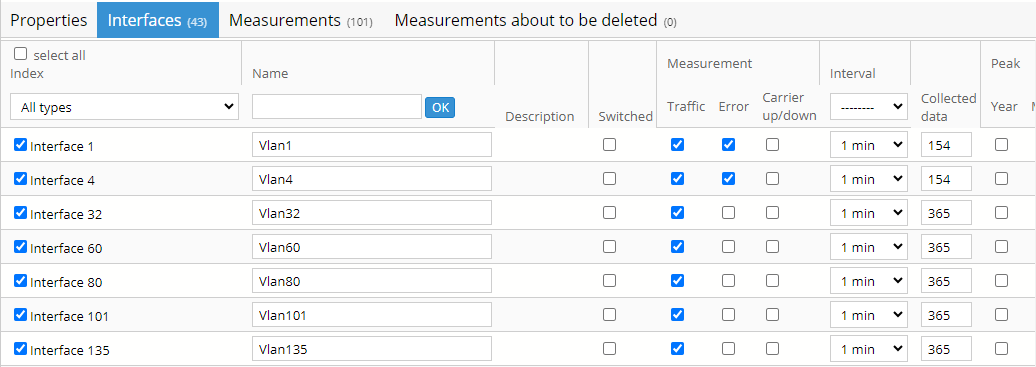
Figure 26. Interface table
6.2.3.2.3 Measurements
The other measurement table can be filtered based on two conditions:
· Measurement name
· Only the currently selected interface or filtering based on type. The “Only the selected” option corresponds to those measurements next to which the checkbox is turned on
For other available measurements the table is very similar, with these differences:
· In the first line there is an [add new] link with the help of which new measurements can be created and after that we get back to the equipment modification page. In theory, the link can be used for the creation of all measurement types according to the equipment type, however, it is recommended only for the creation of measurement types which cannot be discovered on the equipment, i.e. they cannot appear automatically in the table (for example, if the equipment is not discoverable, like the Jaga equipment, or the equipment itself is discoverable but the measurement is not, like the directory size measurement for a Unix/Linux equipment). Important to note: measurements created with the help of [add new] are only placed into the page’s table and they are only really created if the configuration page is saved.
· The measurement columns are missing.
· In the case of non-SNMP data collector, similarly to the equipments discussed above, for each measurement an arbitrary number of other optional parameters can also be displayed according to its type (text, number, checkbox, etc. see the description of the given measurement server type in the Appendix).
· In the case of non-SNMP data collector, the user has the possibility to change the value of the Index parameter. Similar to the [add new] link this feature is available for every measurement type, although its main purpose is to change the value for a type which PVSR cannot automatically discover. For example: in case of a Jaga equipment the Index paramter contains the IP address or host name which is pinged by PVSR. If that changes then it's more convenient to change the value of the parameter than deleting the measurement and recreating it.
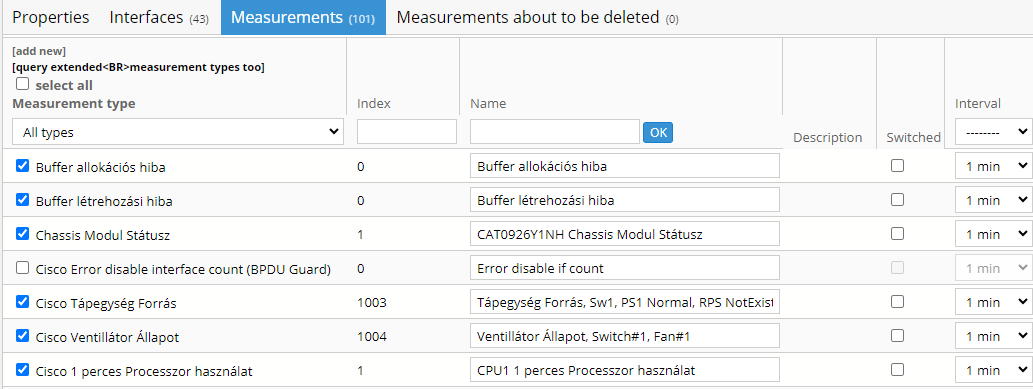
Figure 27. Measurements
In case of non SNMP type equipments, every single configured measurement can have additional parameters. It is important to note that based on the type of the data collector, there can be measurements that are administered together by the system (e.g. HTTP Availability and HTTP RTT are handled together in the case of synthetic transactions, but the DNS Cache Availability and DNS Authorative RTT are not). In such cases the values of additional parameters in the matching measurements are the same whenever the Index values are the same:
· If a new measurement is being added in such a way that another matching measurement already exists with the same Index, then the unfilled parameters will take the value of that one. According to this, even the so called required parameters are not required to be specified and in the case of scroll down or radio button type parameters, choosing the “None of them” value will result in copying the other value, too. This rule is not applicable only for checkbox variables, for them the values specified at creation time are always the ones selected (since a checkbox always defines a value).
· If a measurement is modified, then the change in the additional parameters automatically alter the parameters of the other “matching” measurements on the page
Example:
· A HTTP Availability measurement with index INDEX is added where the value of the “URL address” field is “http://index.hu”
· A HTTP RTT measurement with index INDEX is added where the “URL address” field is not filled, but the value for the “User name” is “user”. For the newly created measurement the value of the otherwise mandatory “URL address” field is automatically set to “http://index.hu”, and for the HTTP Availability measurement the value of the “User name” field is set to “user” as well.
6.2.3.3 Viewing the equipment configuration
When viewing the equipment configuration (by clicking on the icon of the equipment in the list) the page shows the equipment parameters in different groups: main parameters (name, UDAs, …), maintenance window in effect, collection information, configuration changes and other (retry, retention, …) parameters. If Jaga ping measurements belong to the equipment then there is a link for the Jaga configuration in the collection information group. There is also a link in the configuration changes group: clicking on it the UI shows the changes made to the equipment in the last week. If the equipment has an equipment template assigned to it (it was created using that template or the template was used in the last template based rediscovery) then its name is also displayed and the connection between the equipment and the equipment template can be deleted by clicking on the link next to the name.
6.2.3.4 Equipment deletion
We can delete equipments even if measurements belong to them. The deleted equipments, measurements and measurement results will be deleted from the active tables and placed to the archive tables. If JAGA (availability) measurements belong to the equipment deleted then PVSR will offer the deletion of these measurements as well.
The deleted results can also be displayed by administrator users with the Measurement menu item. The delete equipment function should not be confused with the equipment deactivation function: for the former one, the measurements can be restarted for the equipment only if they are created again, and so the definitions of the thresholds and the public and private charts have to be created again as well. In the second case, on the other hand, nothing is being deleted, only the data collection is suspended for the equipment.
6.2.3.5 Modification of measurement intervals
During the modification of measurements, it is possible to change the measurement interval as well. Since, however, this also requires several modifications in the operation of the system, the following restrictions should be observed (these do not apply to the modification of the basic measurement interval for equipments):
· On the collector load page it can be viewed at which time which measurement was unsuccessful. The system uses the actual measurement interval to decide which measurement should have been successful. Accordingly, if the measurement failed earlier, and its interval was modified later, then it will no longer appear in the list of unsuccessful measurements for that earlier time.
· The data reporting module refreshes the measurement data in the system at every hour. Therefore, if the measurement interval is set to a smaller value, then the report engine will interpret this as missing measurement data for some time.
· If a threshold exists that defines a condition for a given measurement, then it is deleted automatically, and is inserted again only if it still contains measurements that have the same measurement interval after the completed interval modifications. For example, if a threshold requires that the interface traffic of both A and B are bigger than 1 Mbps, and for both measurements the interval is modified from 5 to 1 min, then the threshold is deleted and recreated automatically. However, if the interval is modified only for measurement A, then it will be deleted but not recreated.
· The parent-child relationship between thresholds is allowed only between thresholds with same measurement interval. Therefore, this connection remains only if, based on the above, all thresholds in the “parent chain” are modified as well.
· For measurement types the $INT expression can be used in the measurement Unit field. This value is always substituted with the actual measurement interval when charts are drawn even if the whole graph refers to a period in which another measurement interval was valid.
· The data compression module always operates based on the current measurement interval. Therefore, if the interval is reduced and the measurement type is counter or difference (see the Counter parameter at Measurement definitions, but the interface traffic measurement is of this type as well) then only after the specified time (see Collected data parameter) will the detailed measurement results be deleted and no hourly averages will be saved. The reason for this is that the results stored by a larger measurement cycle generate a result as if only every N-th measurement would have been successful when read by a smaller cycle. This way, however, the difference cannot be calculated from the consecutive measurement results.
6.2.3.6 Jaga measurement synchronization
About the Jaga equipments and measurements
The Jaga equipment in PVSR servers as a ping source, i.e. PVSR can ping different IP addresses and host names from a Jaga equipment. Usually there is just one Jaga equipment in PVSR, however the user can choose to create more (for example if he has different virtual private networks and has one collector server in each network). There are three Jaga measurement types: availability, round-trip-time and minimum/maximum round-trip-time. The user must configure the sample time, which means that every X seconds PVSR sends a ping request to the address. The measurements come from aggregation of these ping requests (for example if X is 5 seconds and the measurement interval is 1 minute then the measurement aggregates 12 samples). There are other parameters which can be configured for the measurements, but they are not mandatory. The detailed description of the Jaga measurements is in section 14.1.11.
Showing the measurements for the pinged equipment
Although the ping measurements belong to the Jaga equipment, PVSR is capable to showing them on the Measurement page of other equipments, during the threshold or chart configuration of other equipments, etc… The application achieves this by looking at the name of the measurement and the names of the equipments. If the name of the measurement begins with the name of an equipment then PVSR assumes that it is pinging that equipment, and so it shows the Jaga measurement as if it would also belong to the pinged equipment.
Simple configuration (i.e. synchronization)
The Jaga measurements can be configured the same way as any non-discoverable measurement, i.e. by editing the Jaga equipment and selecting the [add new] link. However since the name of the measurement must exactly begin with the name of the equipment (case-sensitive matching!), and the pinged IP address usually should be the same as the IP address of the equipment in PVSR; it is easy to make a mistake. Even if the user enters everything correctly, since usually there is just one Jaga equipment, it is located mostly at an other point in the hierarchy. More over: if the address or the name of the equipment is changed then the user manually has to edit the Jaga equipment as well.
To ease the Jaga configuration, if the user opens an equipment and it has an IP address field (for example SNMP equipments or Linux hosts) the Operations selection has configuration entries for each Jaga equipments. By selecting such an entry the application will look at that Jaga equipment and will determine one of the following scenario:
1. Neither the equipment address nor the name can be found in the Jaga equipment
2. The address exists but with a different name
3. The name exists but with a different address
4. Both the name and the address exists and they belong to the same measurement instance
5. Both the name and the address exists but they do not belong to the same measurement instance
The displayed page is very similar to the one seen during the additional measurement creation with the [add new] link. However in this case the user cannot change the Index or the measurement name parameters, he can only use the checkboxes to select and unselect the measurements. In the first scenario the application simply adds the new measurements to the Jaga equipment.
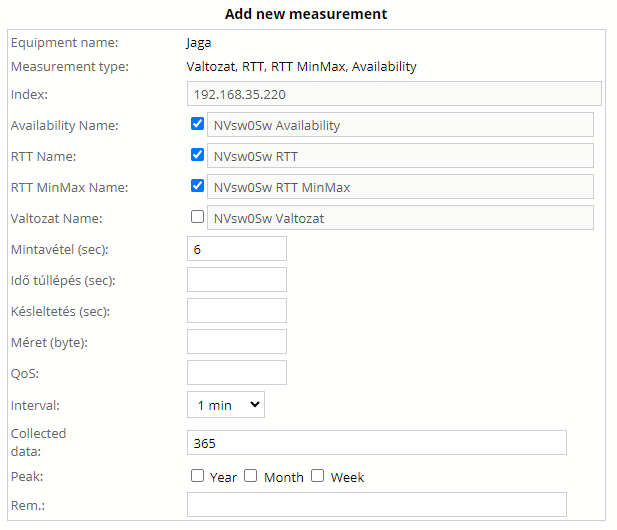
Figure 28. Adding new Jaga measurements
In the second and third scenario the application shows the values which will be changed with red background and after the user has clicked on the OK button it changes them to the correct values.
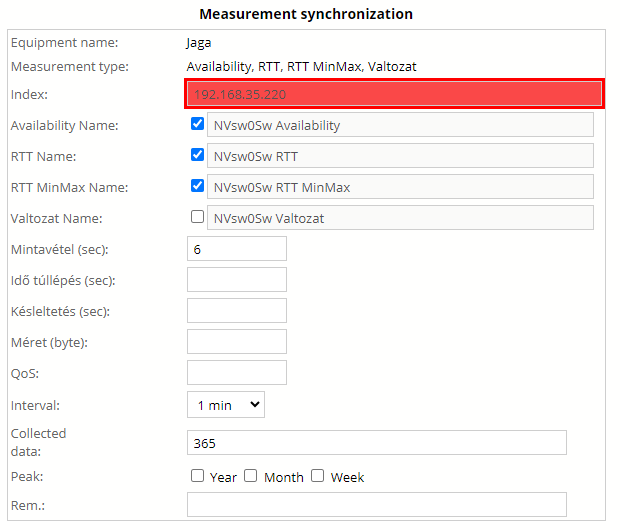
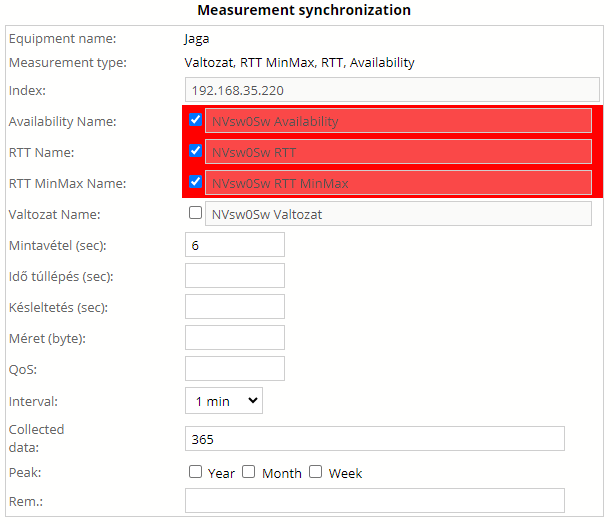
Figure 29. Changing Jaga measurements
In the fourth scenario the application will display basically the same page as during the first scenario, but the name of the page is "Measurement synchronization" and not "Add new measurement". In the fifth scenario the application will display error messages for the conflicting measurements, since it cannot determine which measurement should be changed. In this case the user has to use the normal equipment modification page to correct the errors.
6.2.3.7 Template based creation of single equipment
The users can also create equipments using equipment templates. This can be done one-by-one or in a bulk way. This section introduces the one-by-one approach, while the bulk creation is introduced in section 6.5.1 Template based creation of multiple equipment.
The creation of new equipment from a template is performed by selecting the New equipment from template menu item from the pull down menu on the Site and equipment configuration page, after having selected the parent site of the equipment. Only those templates appear here for the user that are either not assigned to the site (general templates), or they are assigned to the current site (specific templates). If there is more than one available template, the user has to choose the proper one. After that the system orders the templates so that the ones belonging to the data collector type of the current site are listed at the beginning.
If there is only one template, then the system selects that automatically.
As a next step, the non-specified or non-specifiable parameters of the template (e.g. name, or address in case of SNMP) must be filled in. It can also be selected whether the application should try to query the equipment:
· Configured: according to the values specified on the page or in the template
· Add immediately to job queue: It does not even try to create the equipment, but it defines it as a scheduled configuration
By clicking on the “OK” button, in the first case the application tries to create the equipment with its measurements, thresholds etc. immediately. If the creation is successful, then the page containing the measurements of the equipment is displayed and the equipment template is assigned to the equipment, so the user can use it later in bulk measurement discovery or on the “Run equipment template” page. If not, then the application sends an error message and it becomes possible to save the operation as a scheduled configuration.
6.2.3.8 Custom relationship configuration
The relationships for an equipment or a virtual equipment can be viewed by selecting the Relationship elem from the Operation drop-down list when viewing the object in the Site and equipment configuration menu. These relationships enable quick navigation between equipments and virtual equipments when using any Measurements or Alarms menu, or even the Site and equipment configuration menu. A relationship might be symmetric or asymmetric: in the later case it has separate attributes for the two direction, for example two names. After installation the system contains several predefined relationships, but these can be freely modified and extended by the users.
The configuration page lists those objects which have any relationships defined with the currently viewed object. The list has four columns:
· Name of the relationship. If the relationship is asymmetric then it shows only the relevant direction name
· Type and name of the remote object
· Whether the relationship is symmetric or asymmetric
Users can create new relationships by clicking on the [add new] link. Here they can search for a remote object as well define the relationship to be used. The relationship drop-down list contains only those direction names which are enabled for the selected object, however the search result list contains every element, not just those which are enabled for the selected relationship direction (since this can be also changed after the search operation). An object from the result list can be selected by clicking on the [add] link.
Existing relationships can be deleted by clicking on the [del] link or the user can jump to the relationship configuration page of the remote object by clicking on the [goto] link.
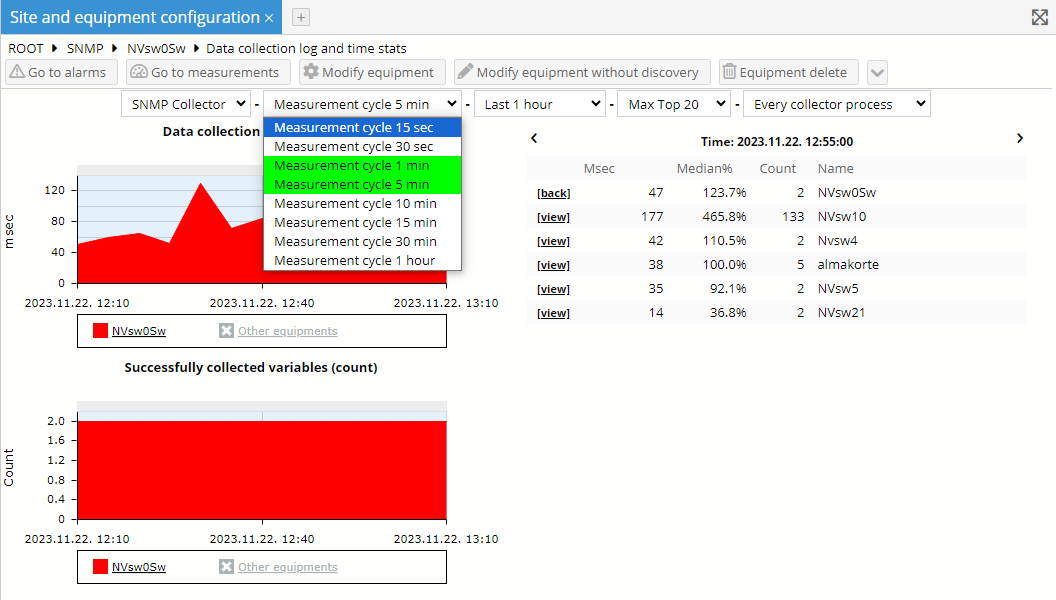
6.2.3.9 Data collection log and time stats
Most of the data collectors provides information about the data collection of each equipment. In these cases the equipment configuration page has a “Data collection log and time stats” drop down list where the user can select a data collection interval and view these additional information about data collection.
The statistics page is divided into three section: settings, data collection time statistics and data collection logs. The setting area contains five configuration parameters, changing any of them results in reloading the page with the correct information:
· The first parameter is data collector module, which contains evert data collector module belonging to the same data collector group as the equipment
· The data collection interval list, where the green color indicates that the equipment currently has measurements with that interval
· The timespan for the statistics calculation
· The topN equipments whose statistics should be displayed as well for each collection cycle
· Some of the data collection is done in parallel, if so then whether every other equipments should be taken into consideration for the topN list or only those, which were collected by the same process as the selected equipment
Some data collectors (for example the Jaga PING measurements) does not provide time statistics, only log entries. In these cases the last two setting parameters are disabled and the page does not contain information on the second area.
The time statistics area shows two charts and a table, and the content of the table is automatically changes as we move the cursor over the charts. The first chart shows the time it took to collect the data from the equipment in milliseconds, and the second chart shows the variables successfully collected. It is important to note that the variables are not the same as the measurements, since each measurement can have in its calculation several variables and each variable can appear in multiple measurements. So not the actual values on the second chart should be taken into consideration, but rather the changes in the values. The charts also have a by-default hidden chart member, which can be turned on and it shows the cumulative values for all the other equipments.
The table shows the topN equipments in that data collection cycle along with the selected equipment. For each entry it shows the time it took to collect the data, how this value relates to the median collection time in that cycle and the number of collected variables. Please note that the time of the table can be changed also by clicking on the arrow icon at the top of the table.
The third area show log messages related to the data collection of the selected equipment. Each line has a “nominal” timestamp, a “real” timestamp, a log level and a log message.